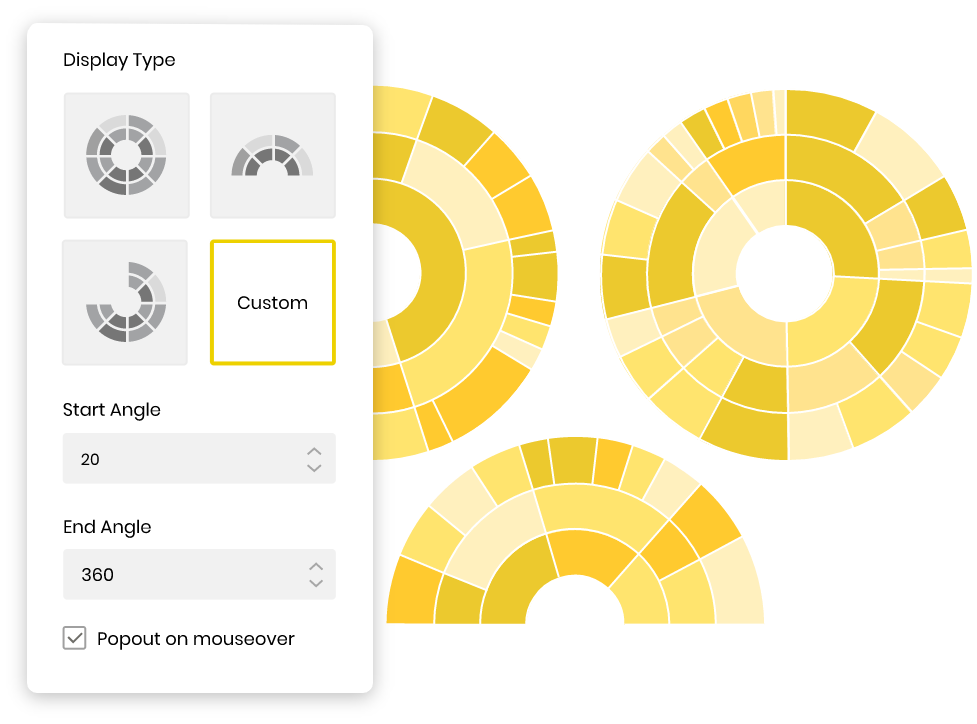
Variety of Chart Styles Powerviz gives you flexibility to change the display style to any custom angle.
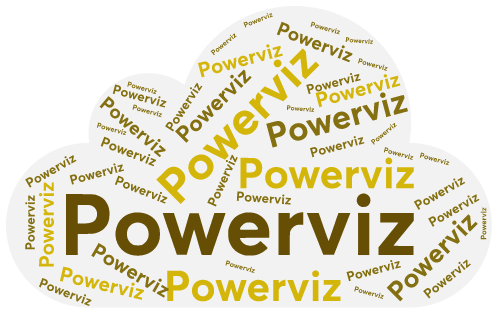
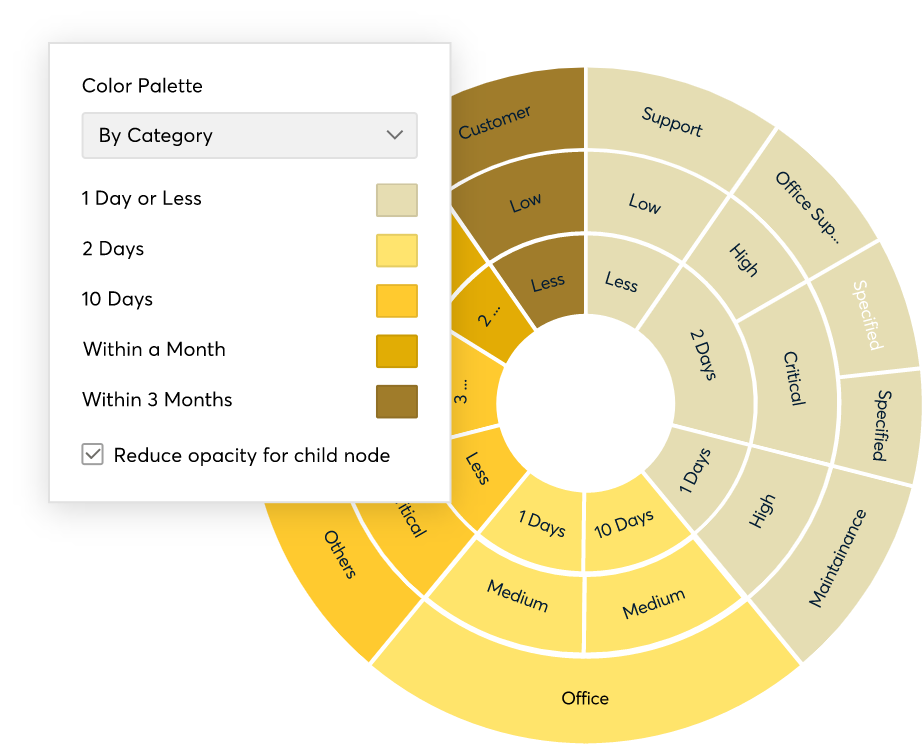
Powerviz offers multiple color schemes and more than 30 color palettes to choose from. For accessibility, there are also colorblind-safe palettes available.
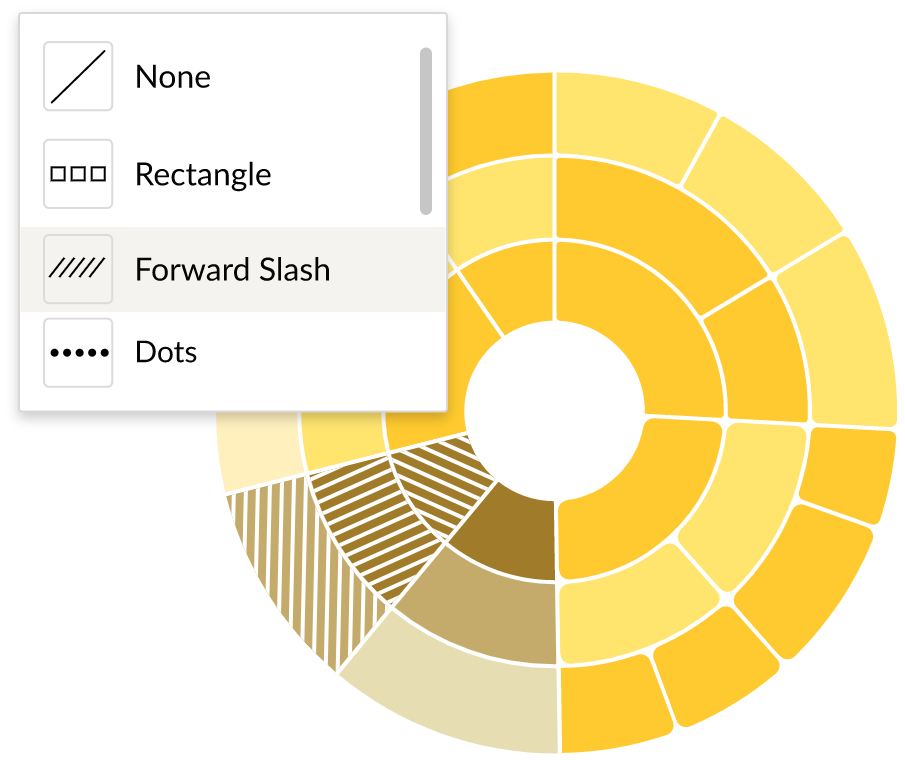
One of the unique styling options that Sunburst offers is pattern. Use patterns to draw attention to or create a subtle effect on a category.
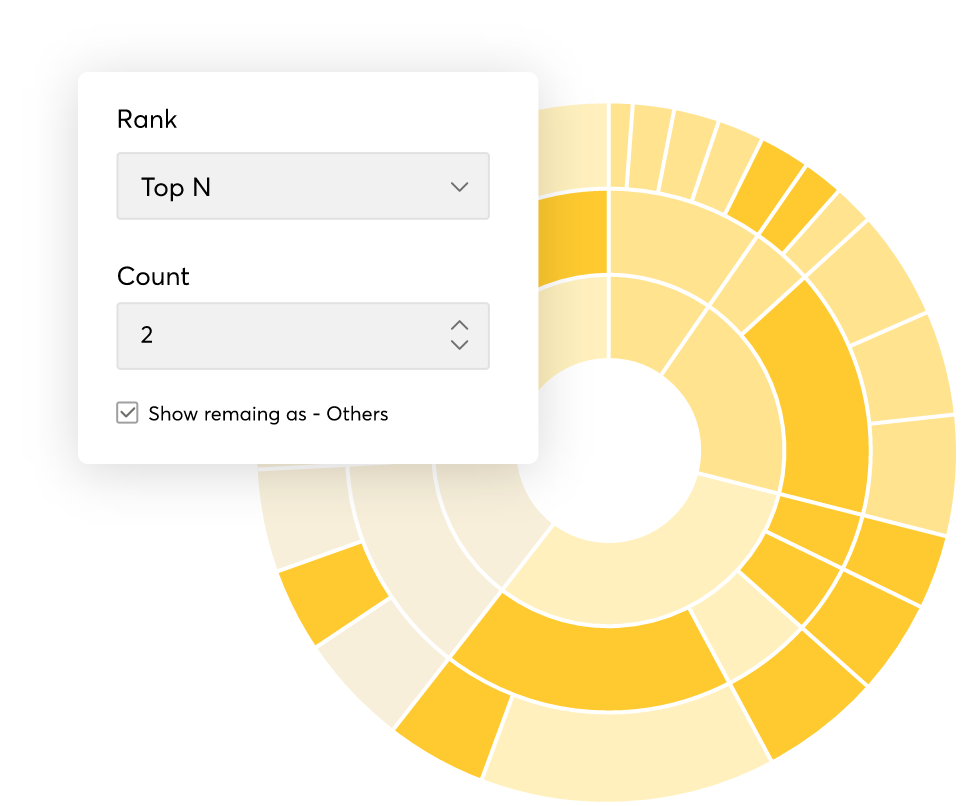
Apply uniform ranking on all the layers. Powerviz Sunburst ranking uses a unique method. The chosen ranking 'N' will apply to all the levels and their hierarchies without using any code.
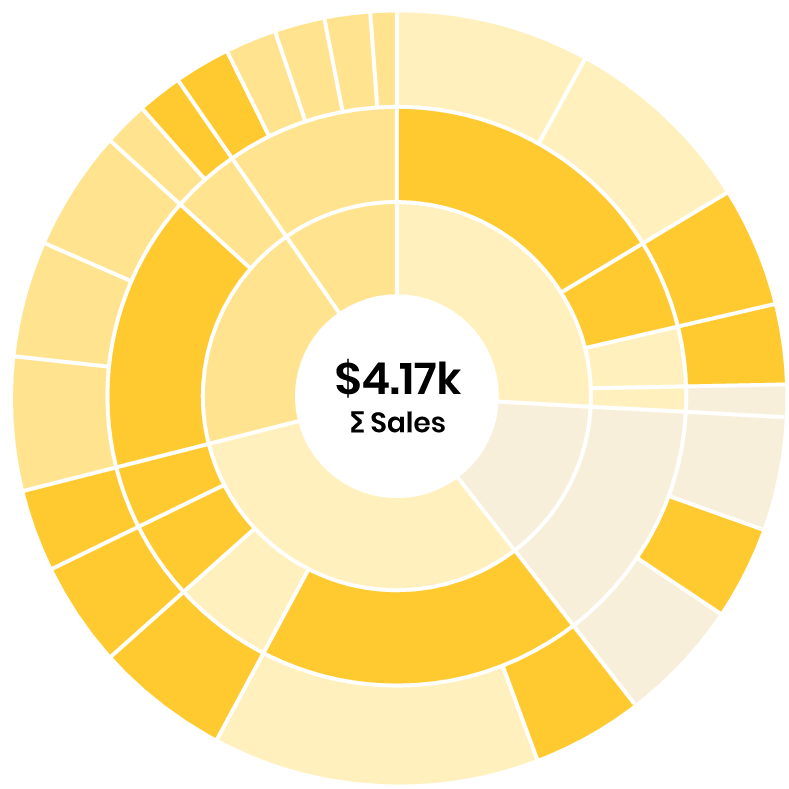
Use a combination of text, measure, icon, and uploaded images to style the center area of the sunburst.
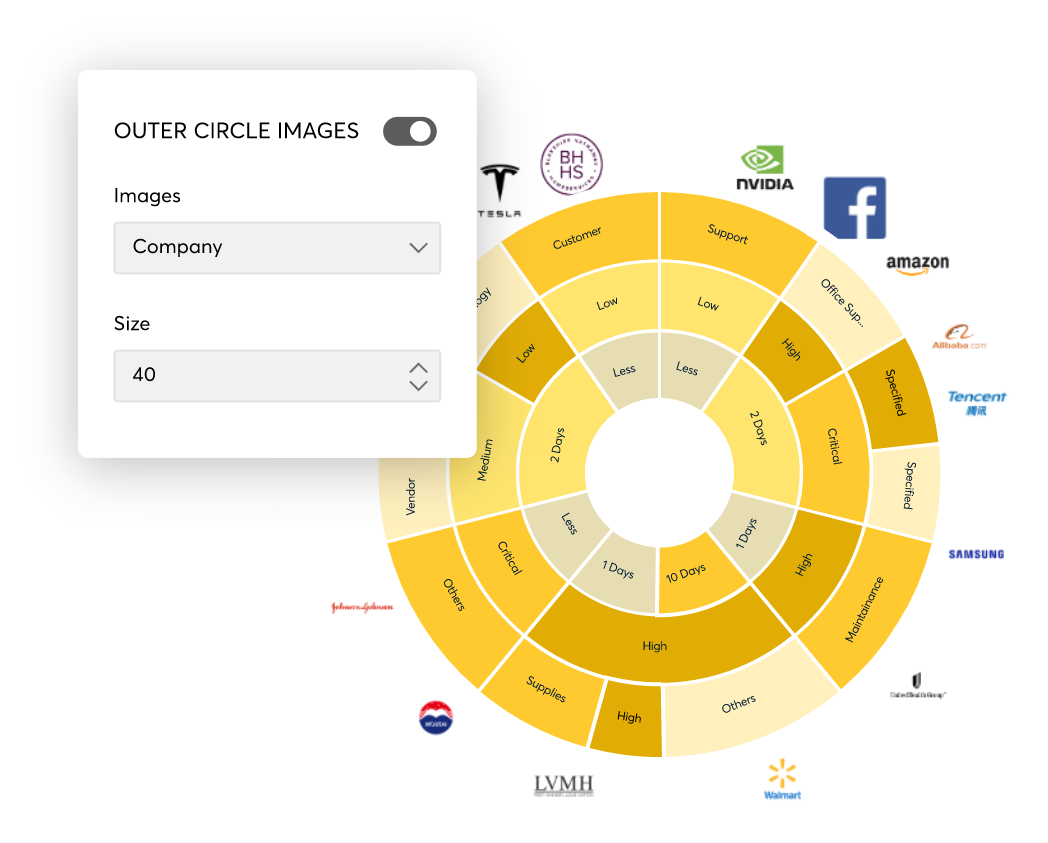
Sunburst lets you display the custom images on the outer circle for the child node.
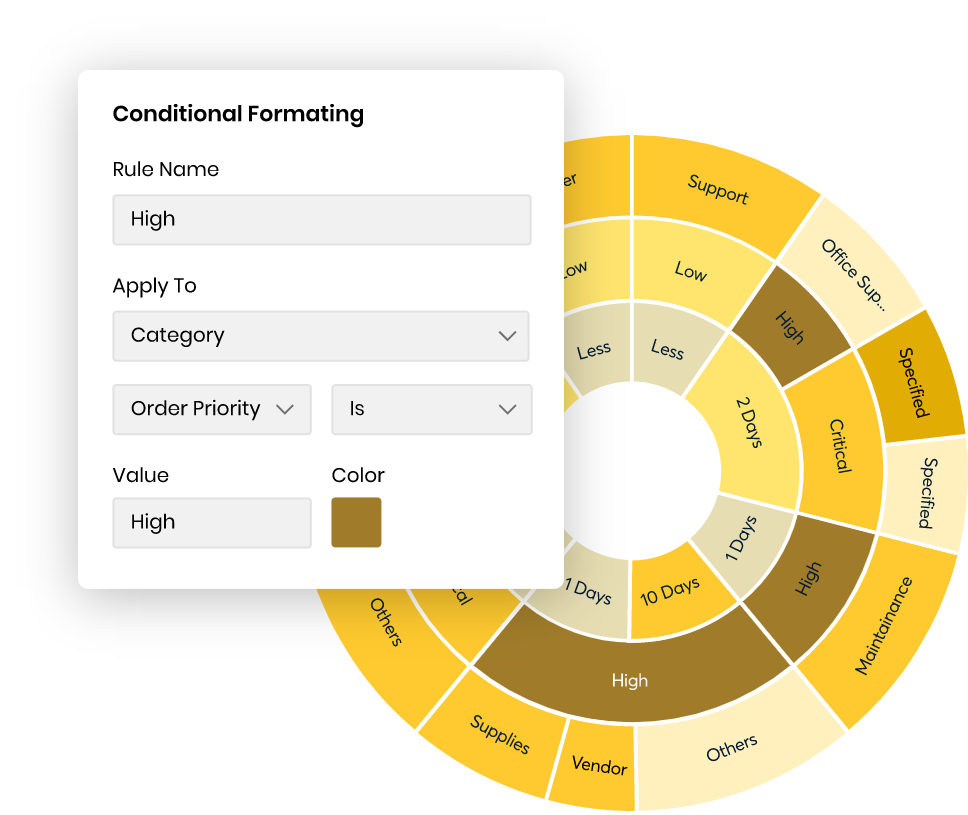
Easily detect outliers or patterns using conditional formatting. We provide conditional formatting based on value and text.