A Powerviz Network Graph is a visual representation of objects (called nodes or vertices) and the relationships or connections (called edges or links) between them. The Network Graph includes features such as clustering, the relationship between the nodes, fill patterns, 30+ color palettes, conditional formatting, shape customization, line customization, directional arrow, and many more.
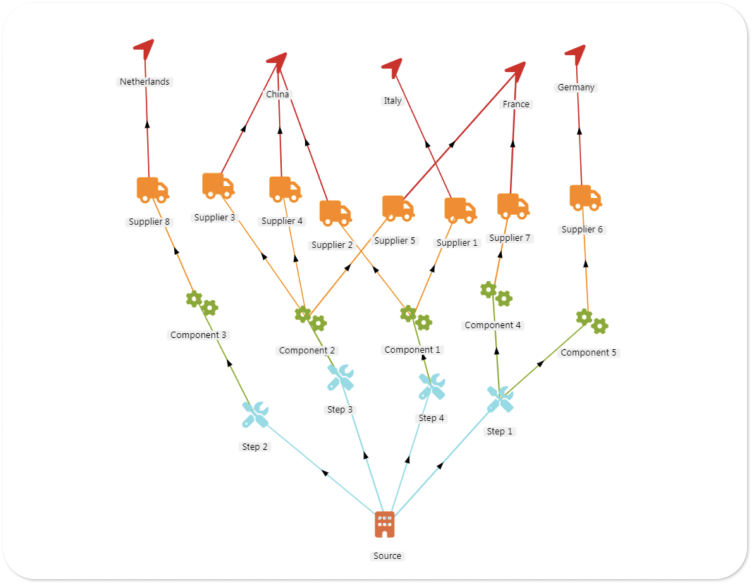
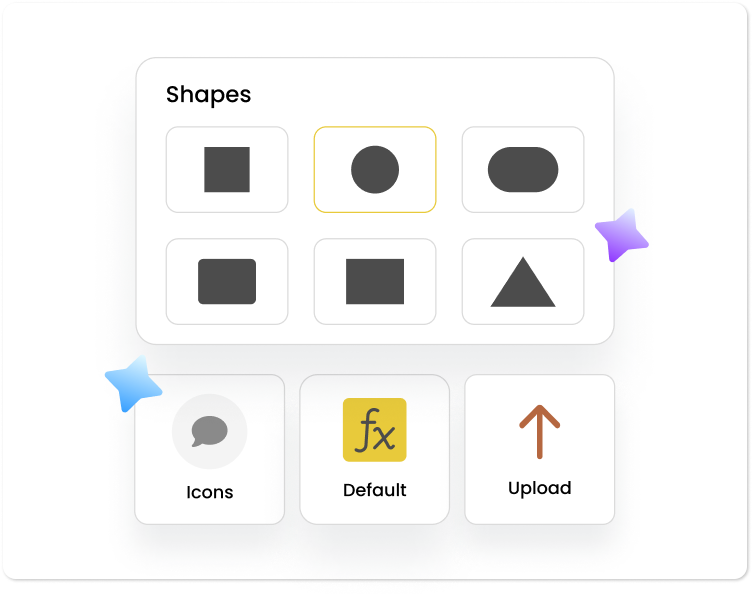
Choose from various Shapes and icons or provide your personal touch by uploading.
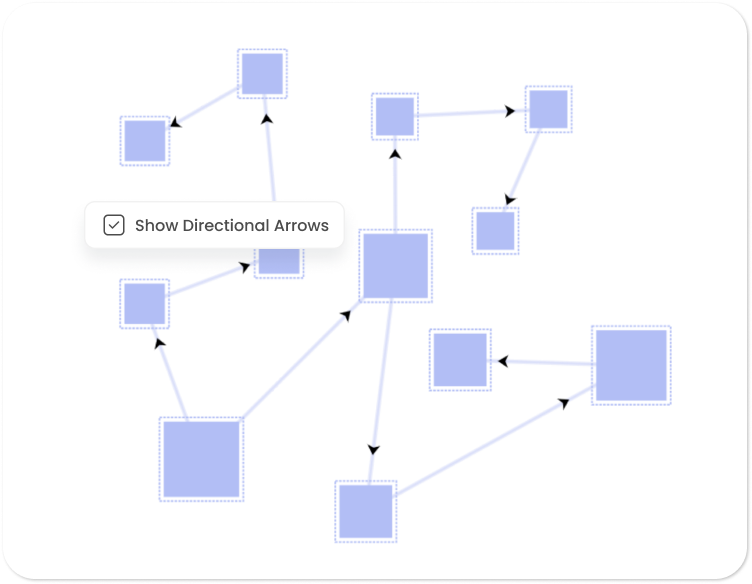
In a click add directions to your Network Graph.
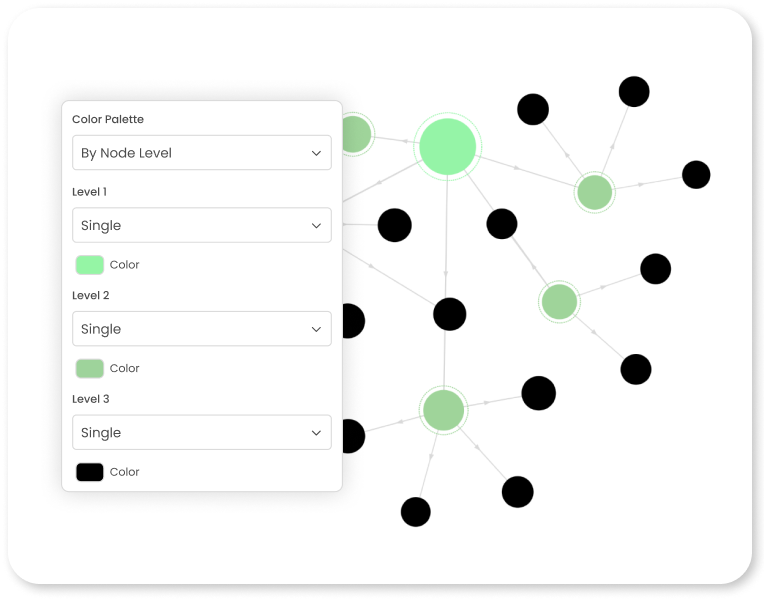
Powerviz offers 30+ color palettes to choose from. For accessibility, there are also colorblind-safe palettes available.
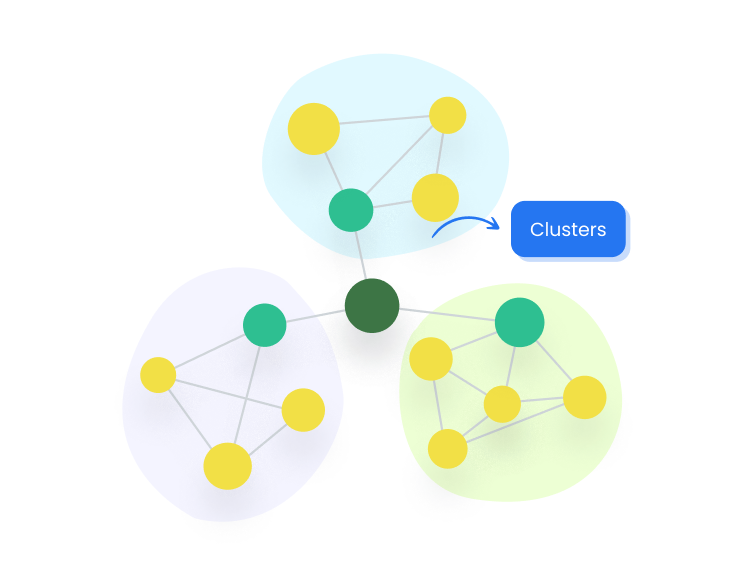
Group similar nodes into clusters to highlight patterns and connections.
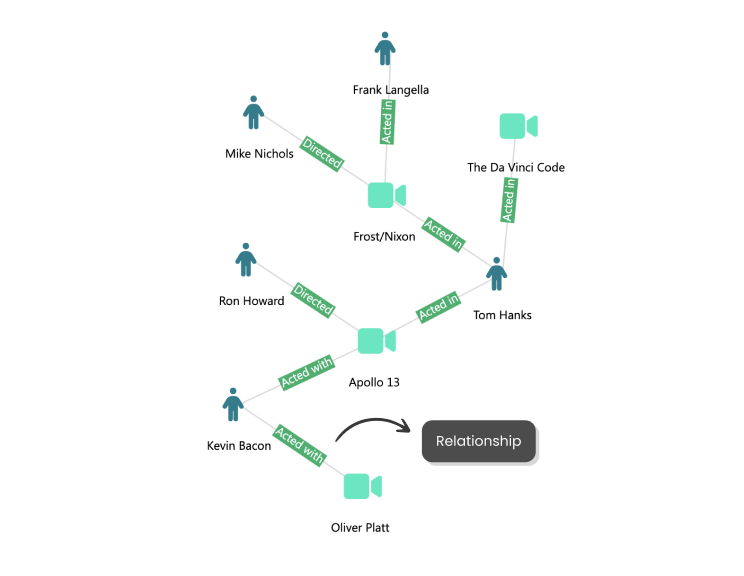
Highlight the relationship between the nodes just in single click.
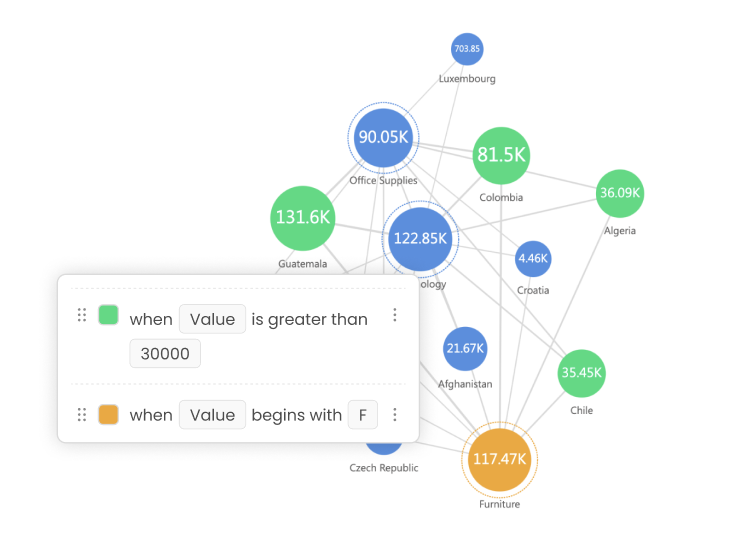
Easily spot outliers using predefined rules, without using DAX.
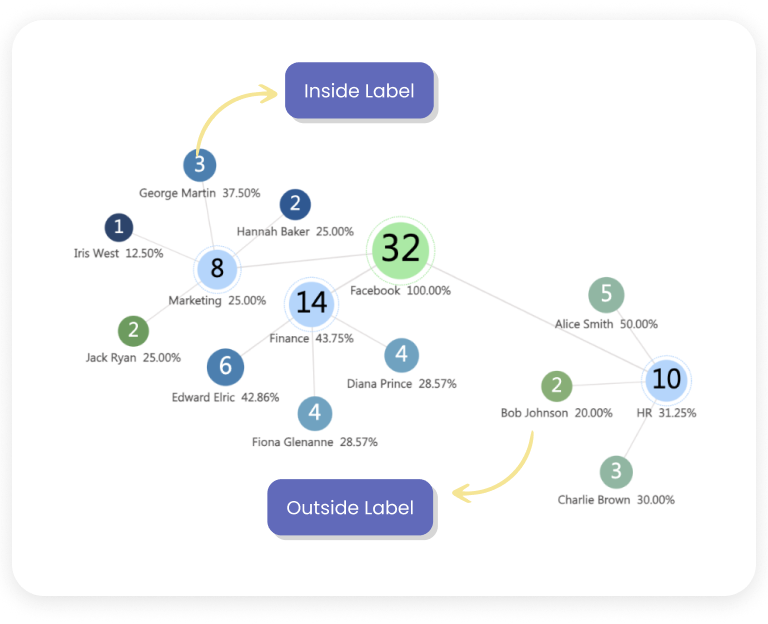
Place the data labels inside or outside the marker. You can also add custom labels.
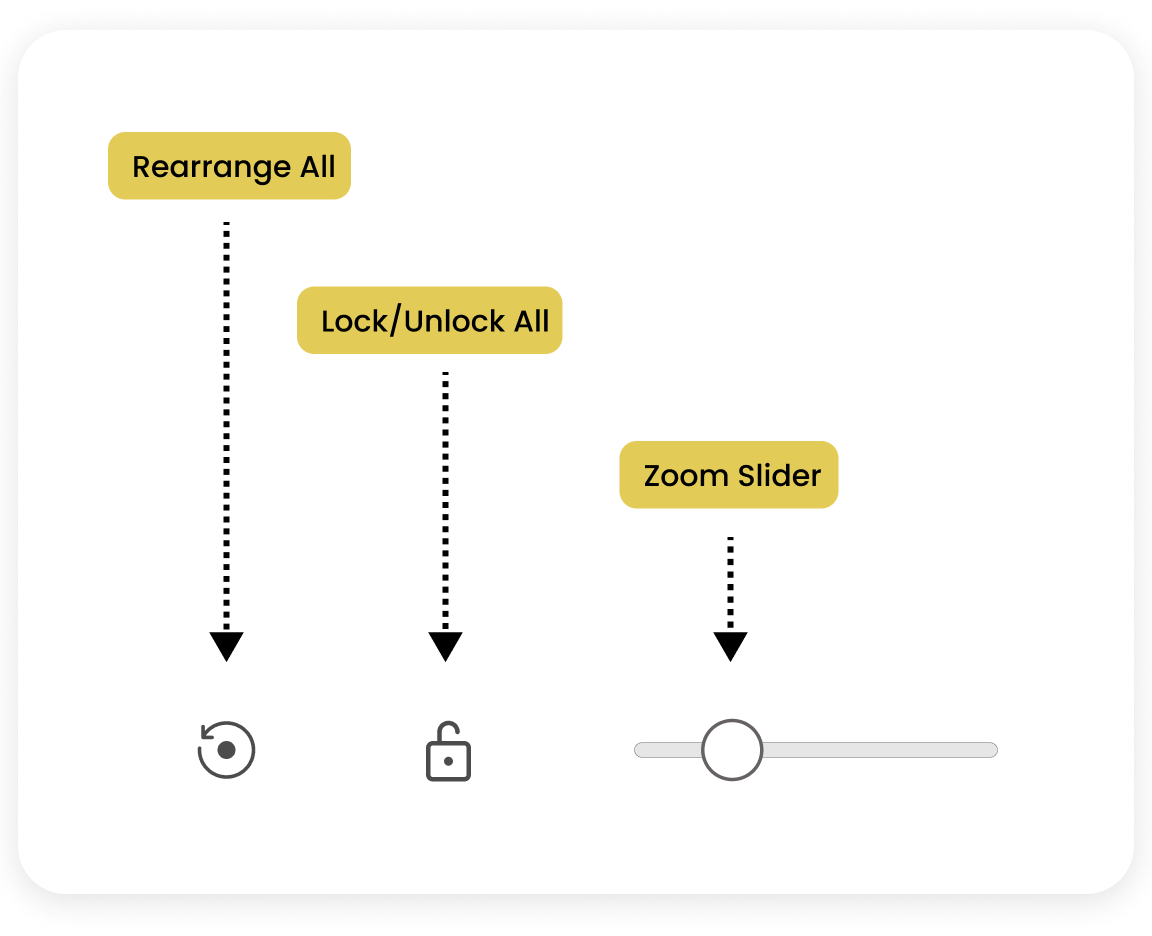
Get more control over the Network graph with an advanced toolbar.
