A Powerviz Lollipop Plot is essentially a bar plot with the bars replaced by lines topped with dots. It illustrates the relationship between a numeric variable and a categorical variable. This advanced lollipop chart includes vertical and horizontal styles, IBCS templates, small multiples, race charts, error bars, conditional formatting, 30+ color palettes, a preview slider, and many more.
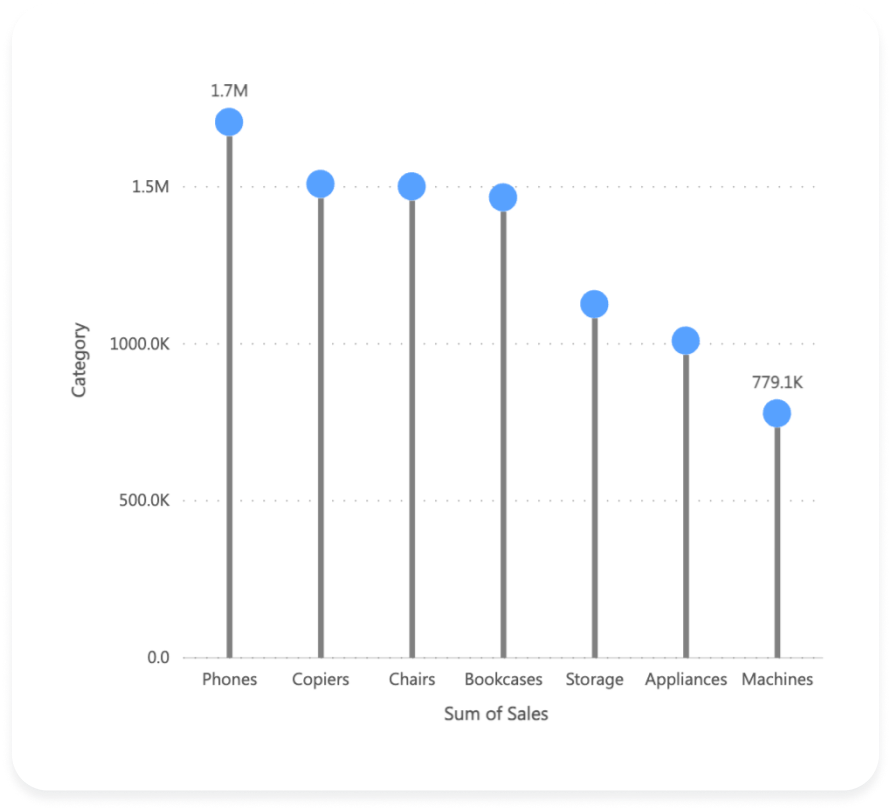
Easily switch between Vertical and Horizontal chart styles in a single click.

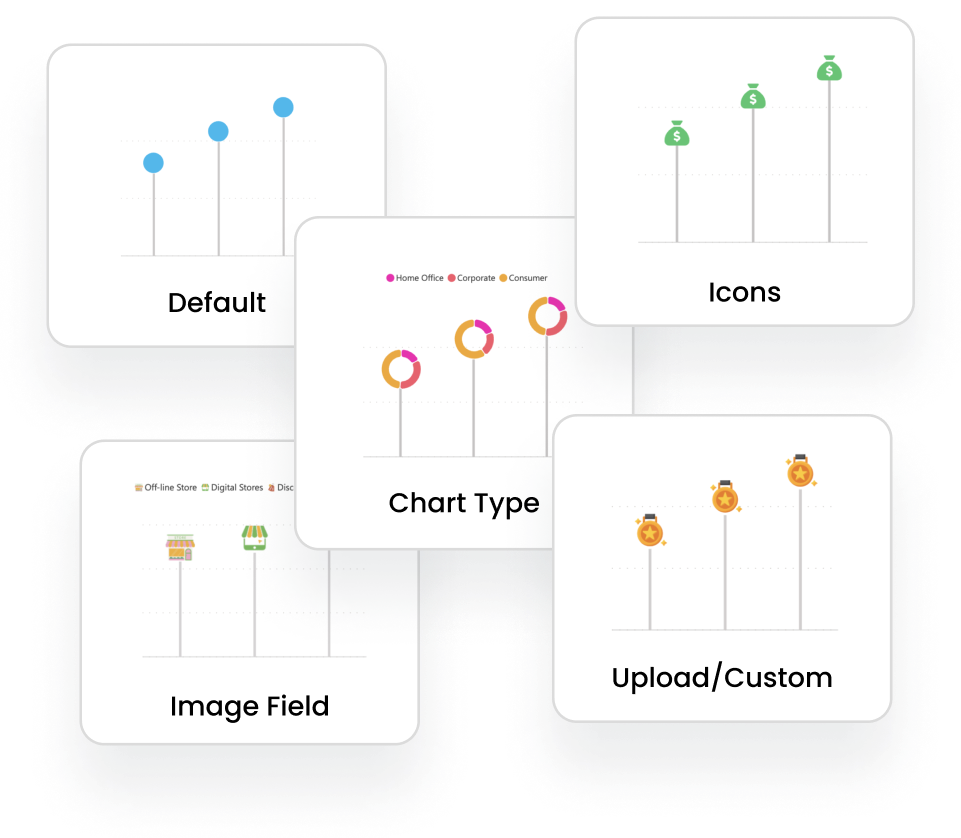
Choose from a variety of marker styles or upload your own for a personalized touch!
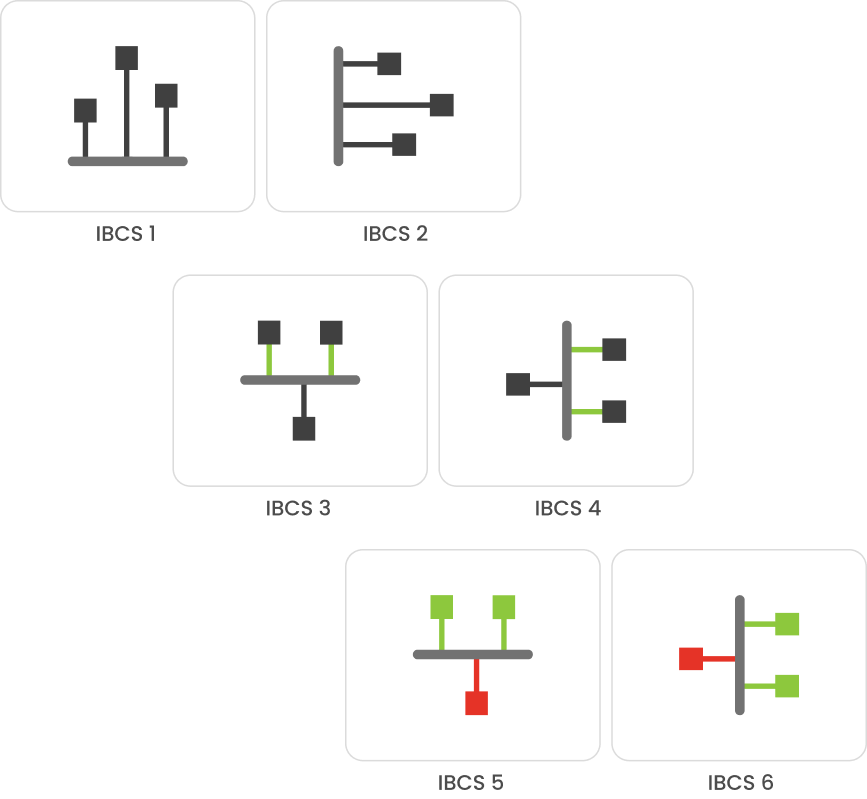
Powerviz Lollipop supports IBCS by offering IBCS templates, making it easier to create standardized and effective visuals.
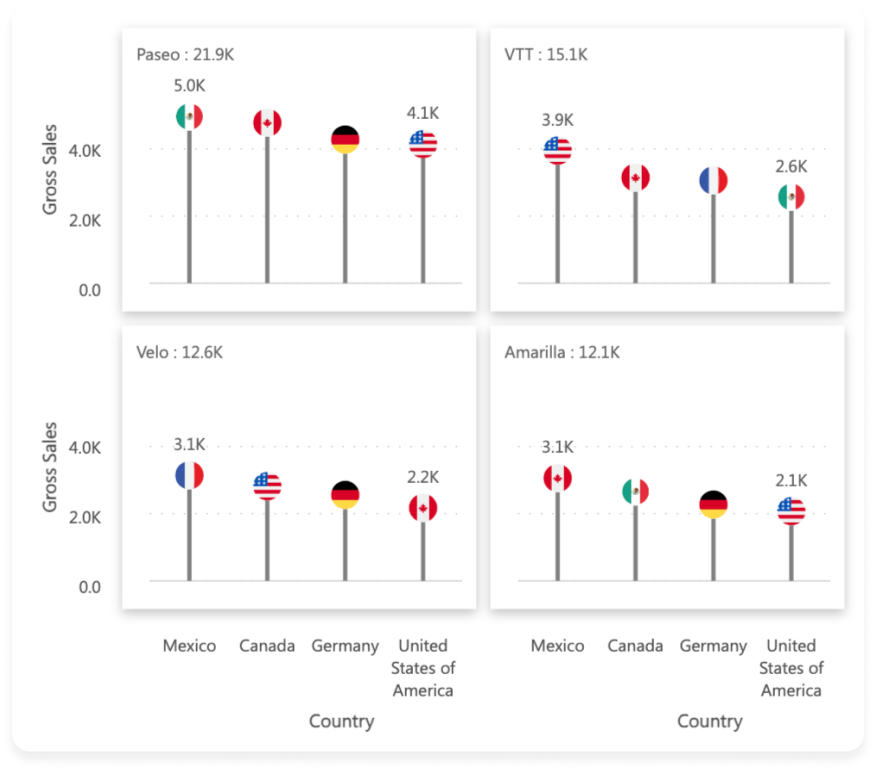
Split your visual into multiple smaller visuals based on the field selected.
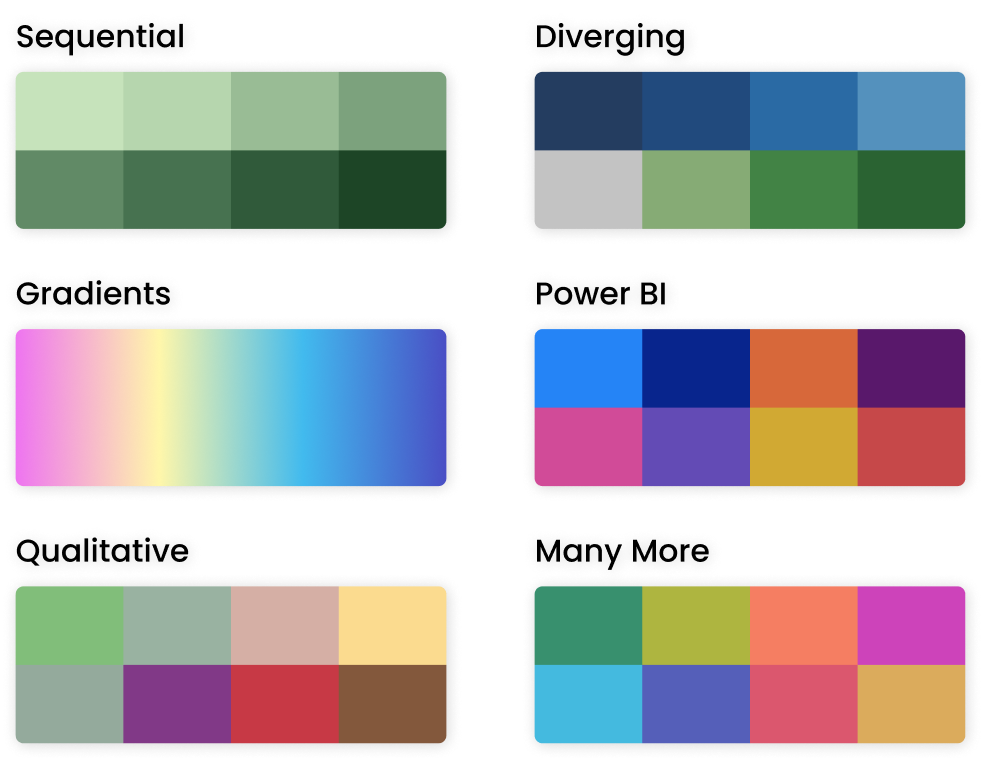
Powerviz offers 30+ color palettes to choose from. For accessibility, there are also colorblind-safe palettes available.
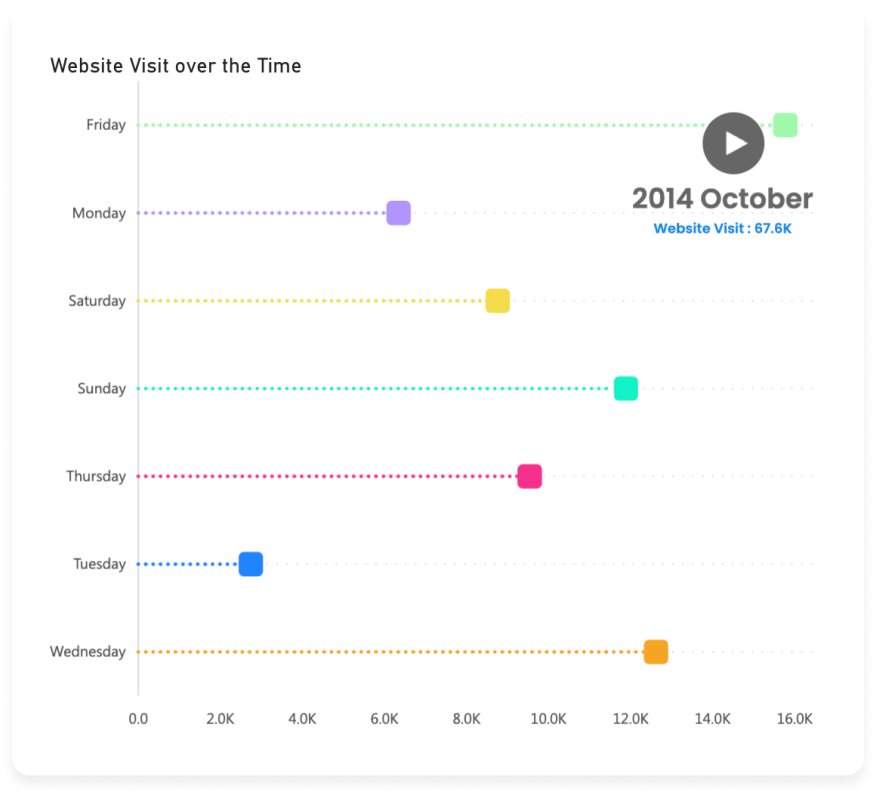
Visualize changes in trend over time just in one click.
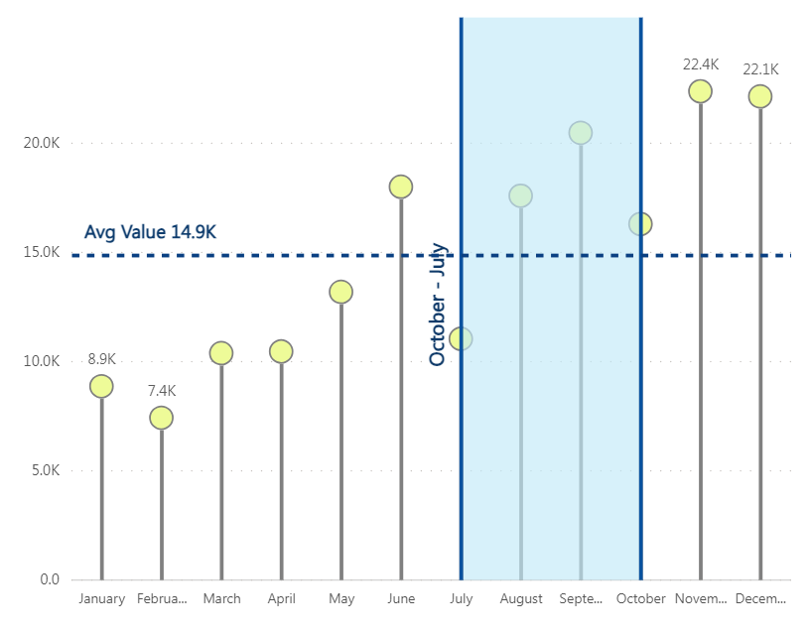
Add a Reference line or Band to highlight or compare the data against a range of data.
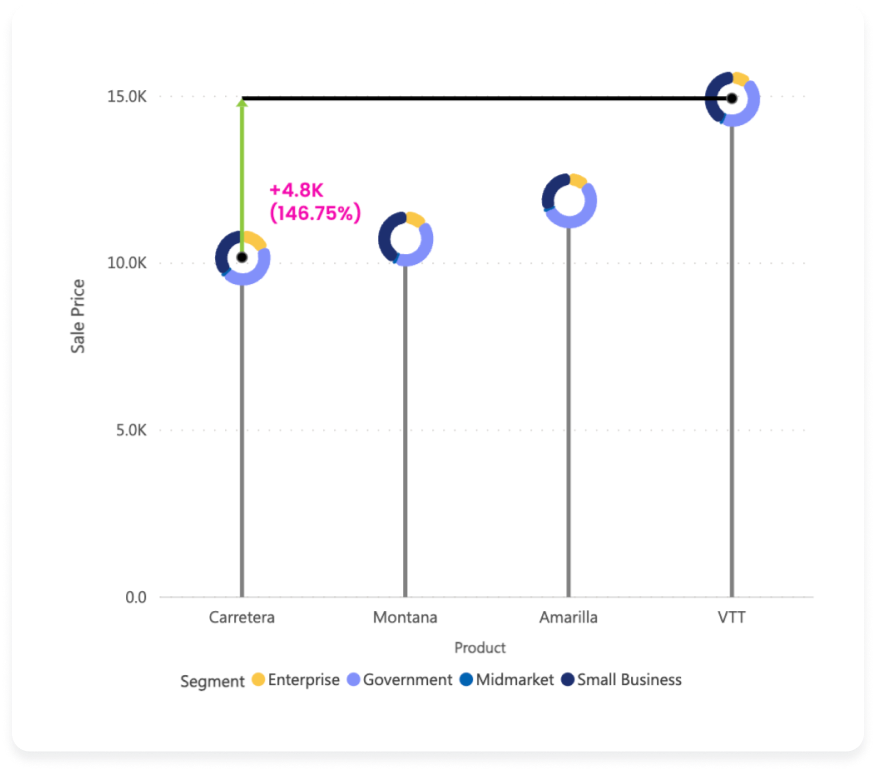
Analyze the variance between two measures using this feature.
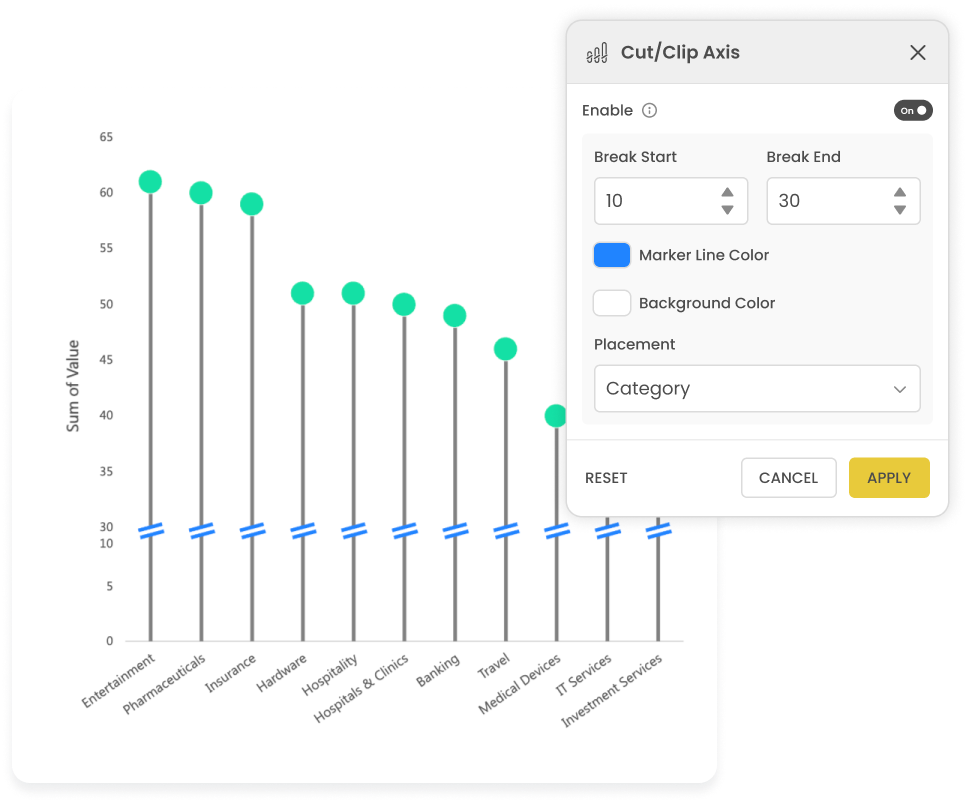
Trim or adjust the axis to accommodate the outliers within the same chart.
