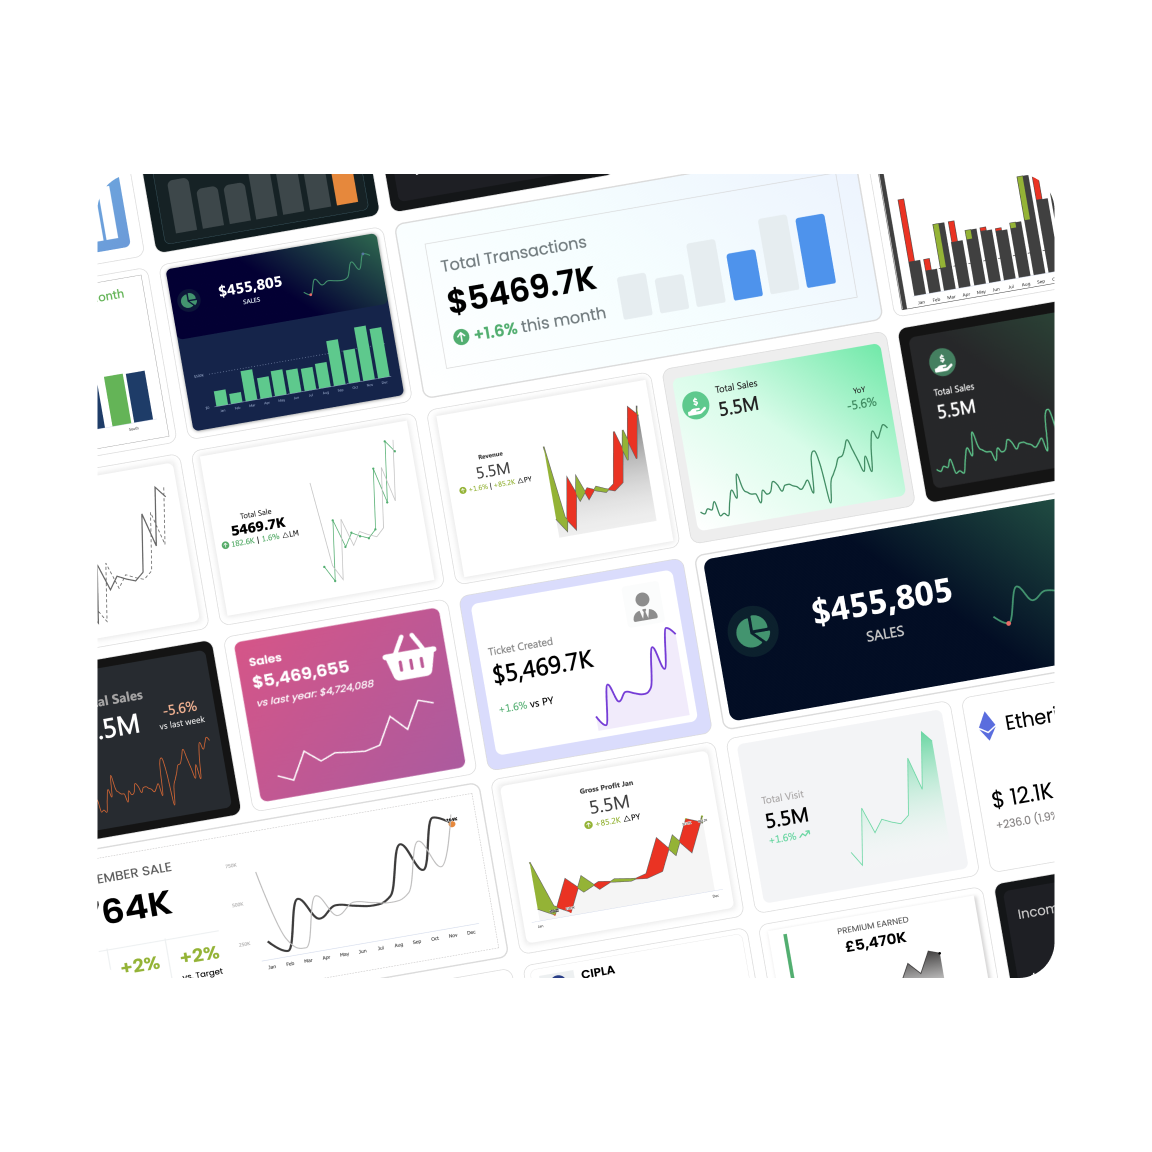
KPI by Powerviz is a powerful custom visual for Power BI that allow users to visualize and create eye-catching and advanced Key Performance Indicators (KPIs). KPI offers 100+ pre-built template within the visual or create your own templates. Using advanced text editor, and on-object layer you can create pixel perfect designed visuals in your next report. The best part about KPI is no prior learning is required. This add-on provided all the key feature you need to create a fully dynamic KPI and sparklines.
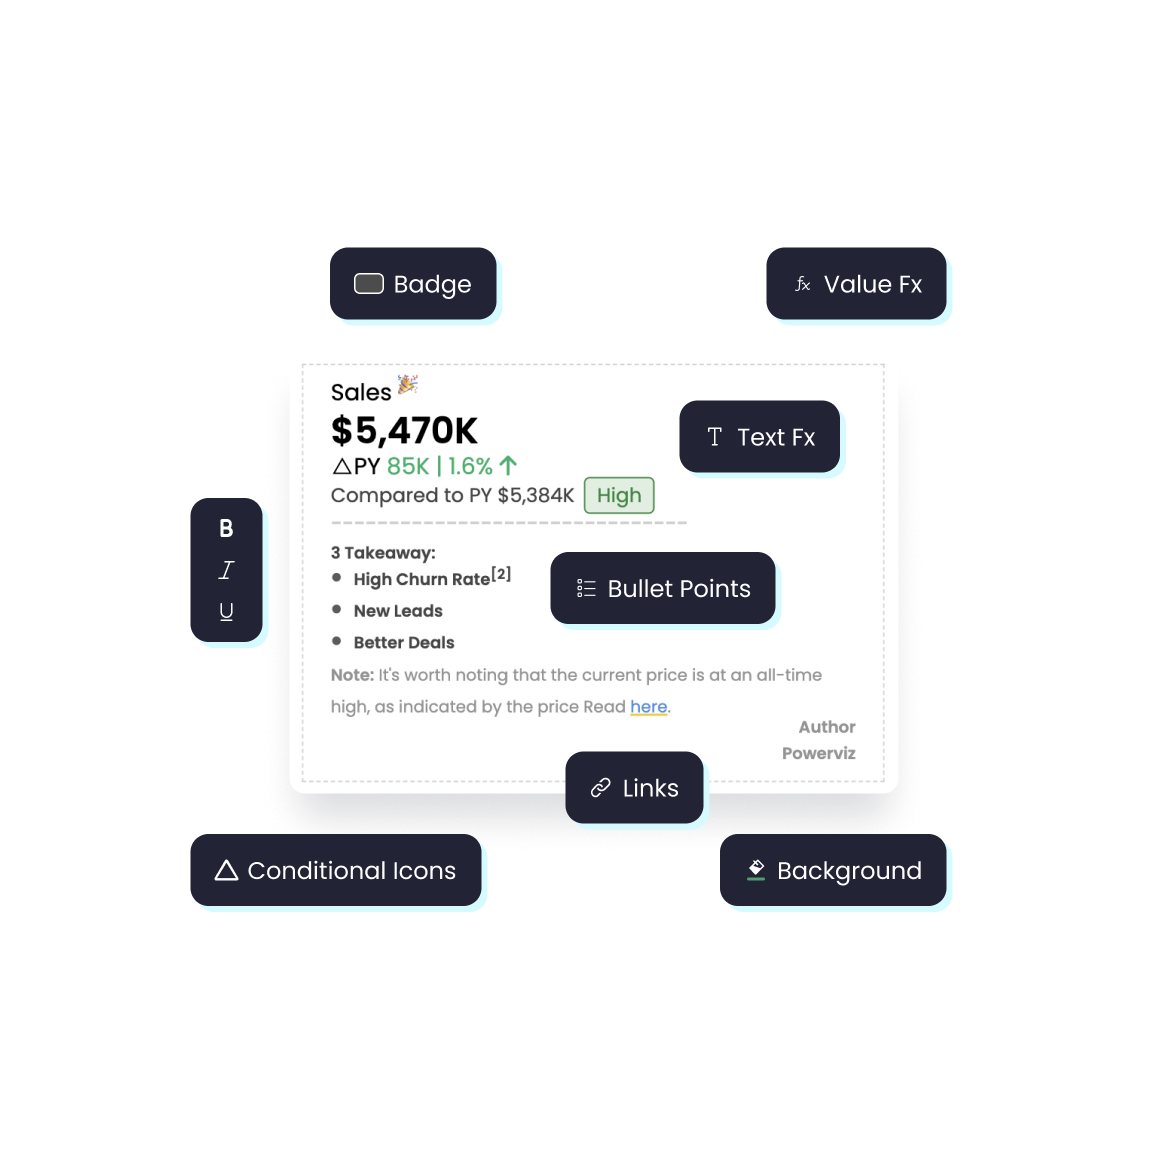
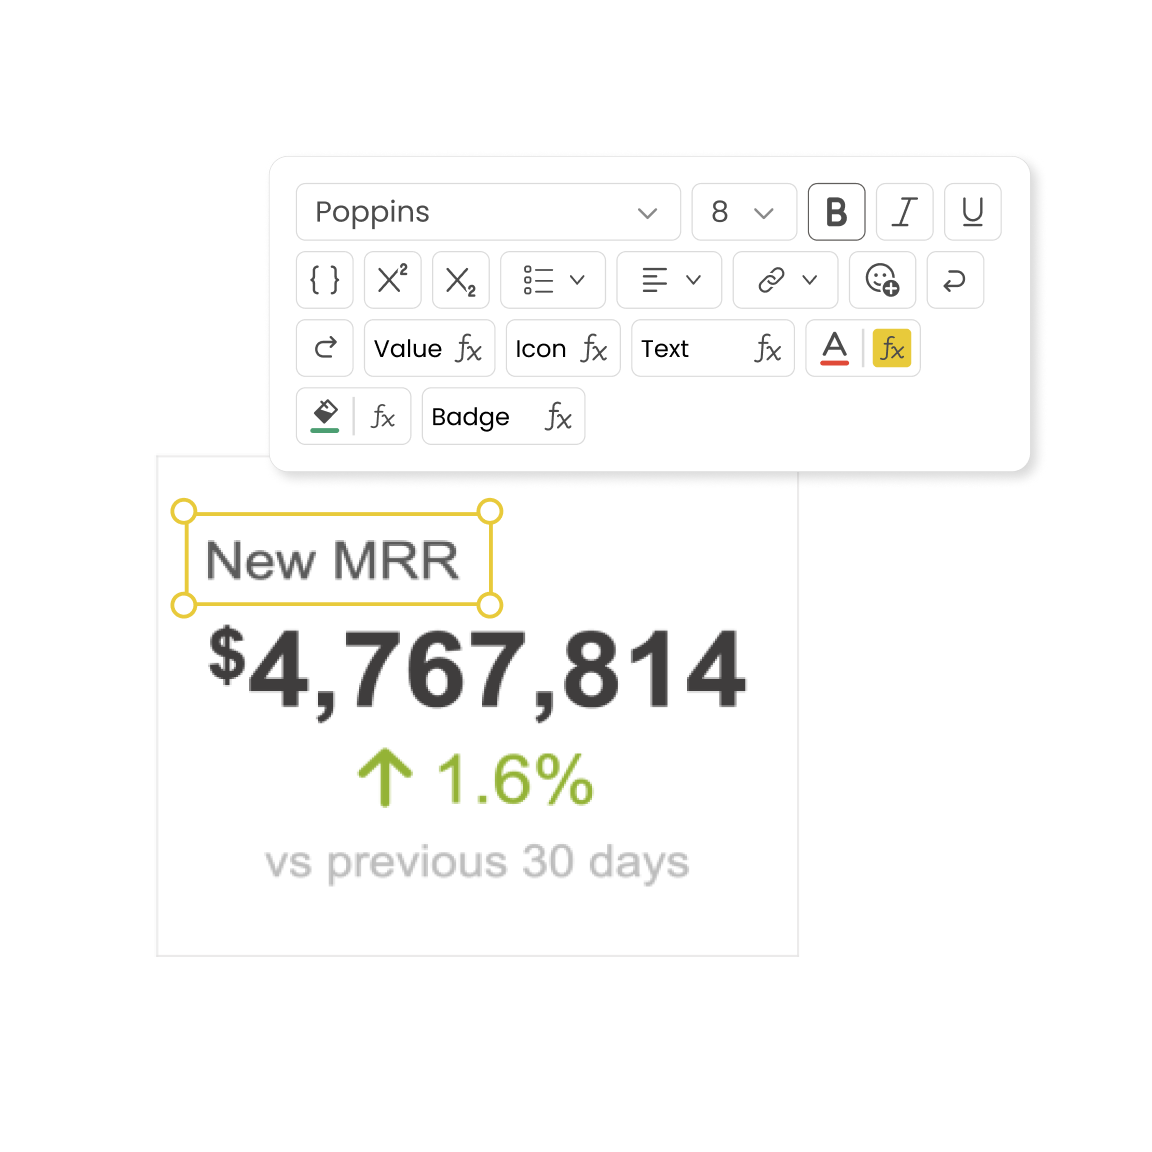
The advanced text editor lets you add Value FX, Text FX, Icon FX, and more—without any hassle
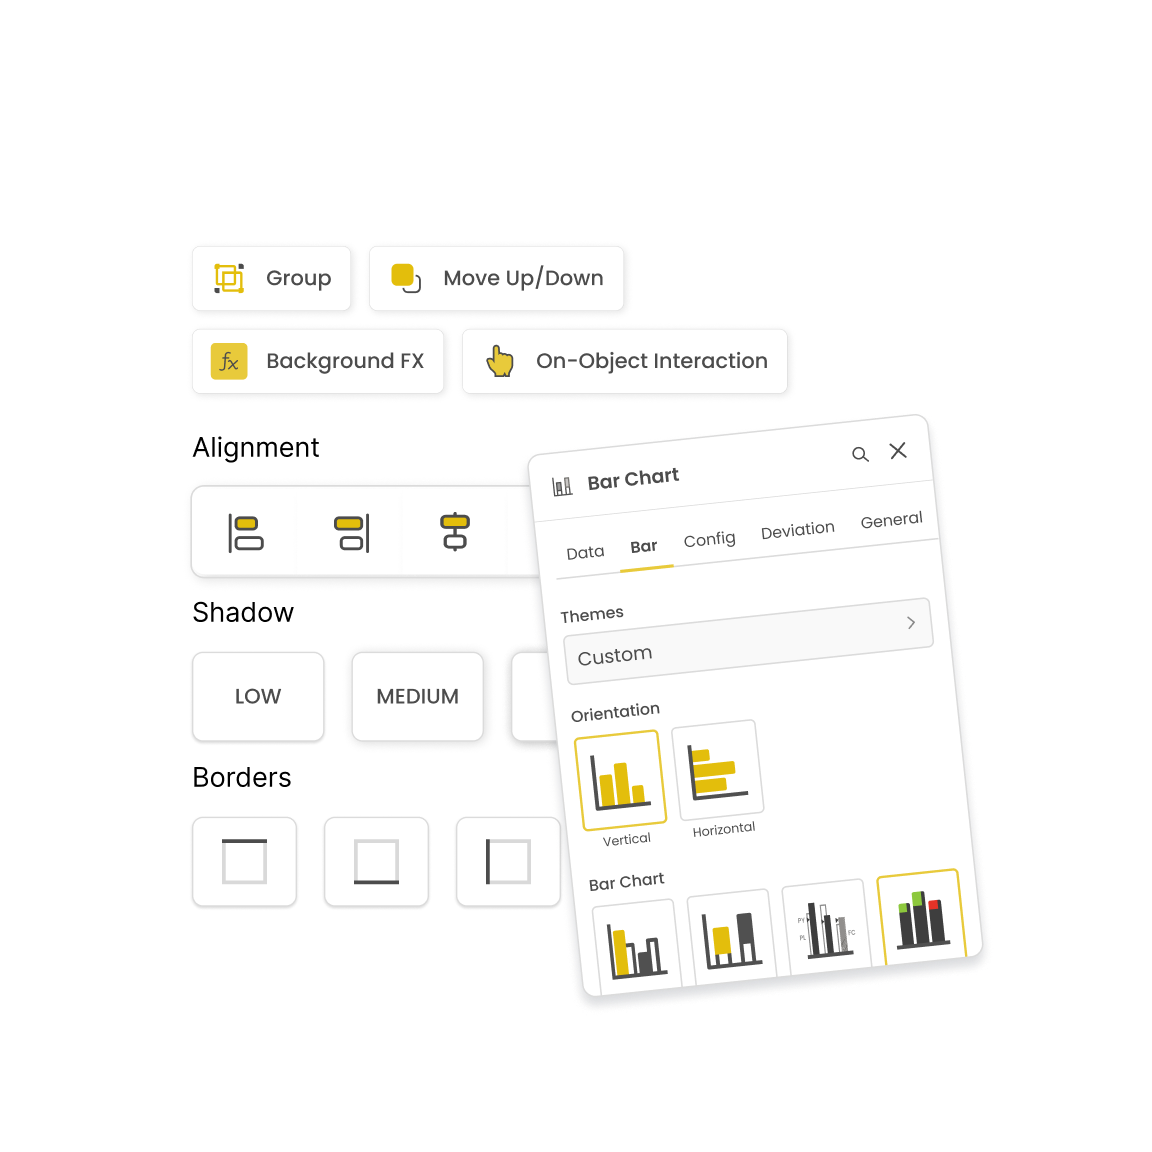
Create 16 layers and over 40 chart variations. Whether it’s trends, comparisons, part-to-whole or performance metrics, KPI has you covered.

No prior expertise needed! With an intuitive interface, you can design stunning visuals for your reports.
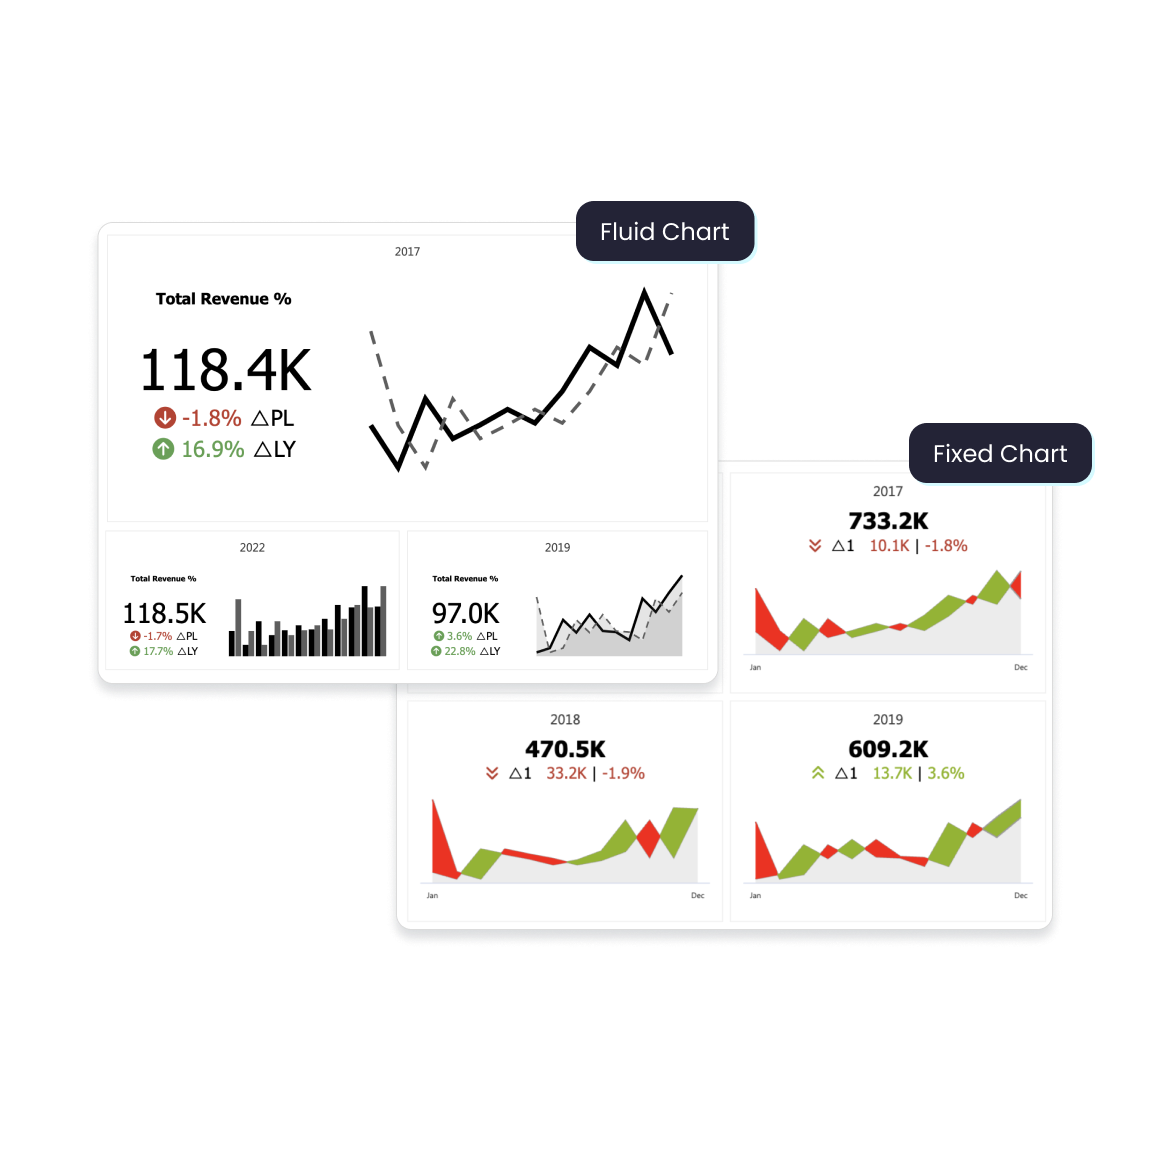
Create fixed and fluid variation of KPI cards across multiple categories that allow easy comparison for quick analysis.
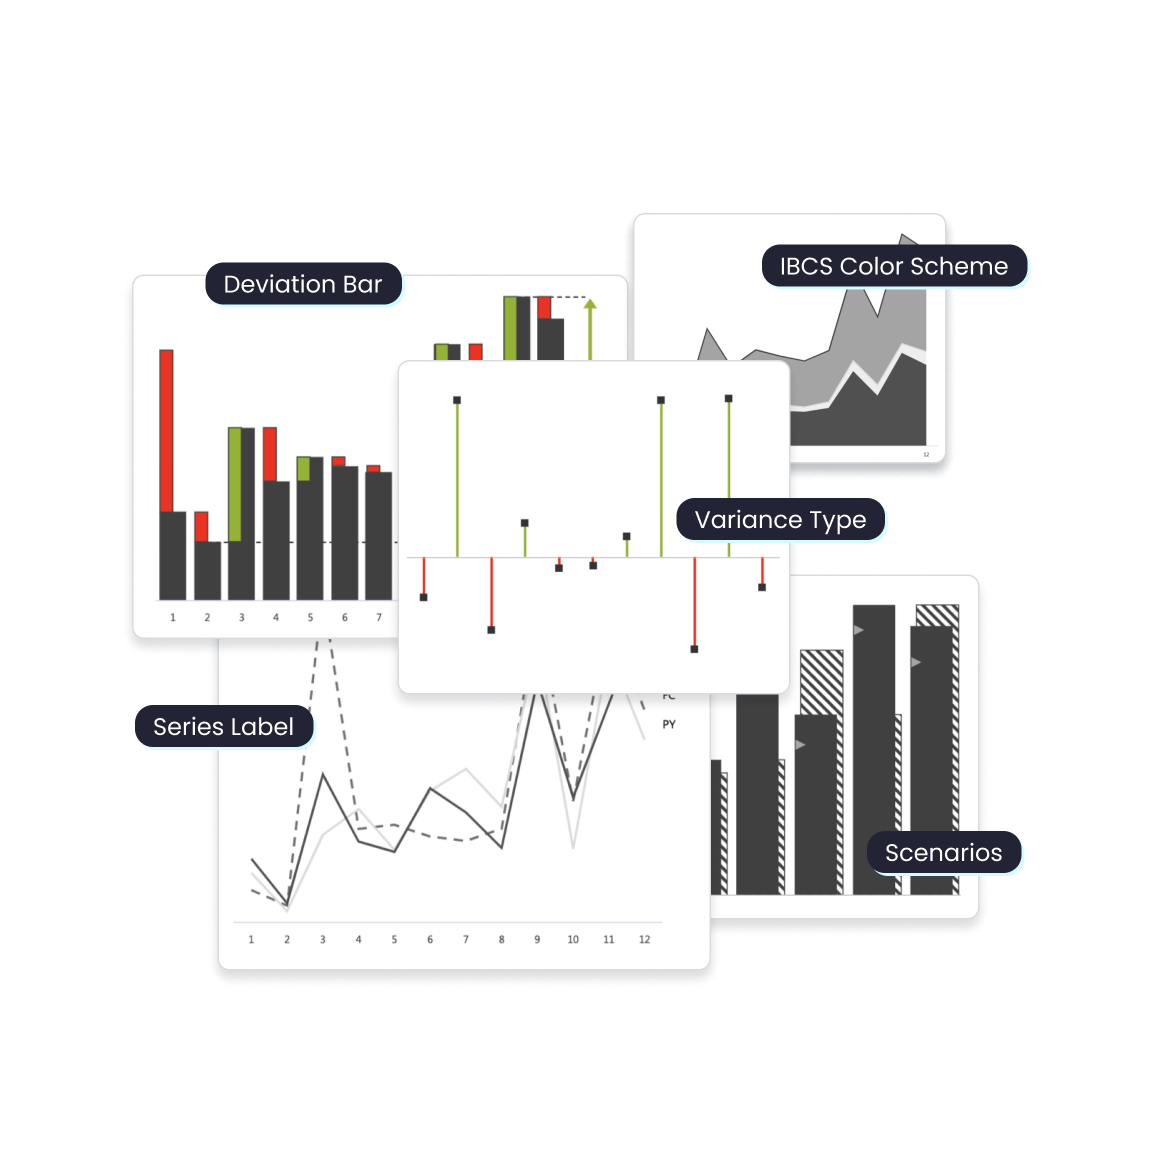
Most of the KPI visuals support IBCS theme and features.
Engage with your visual elements seamlessly, enhancing your analytical experience.
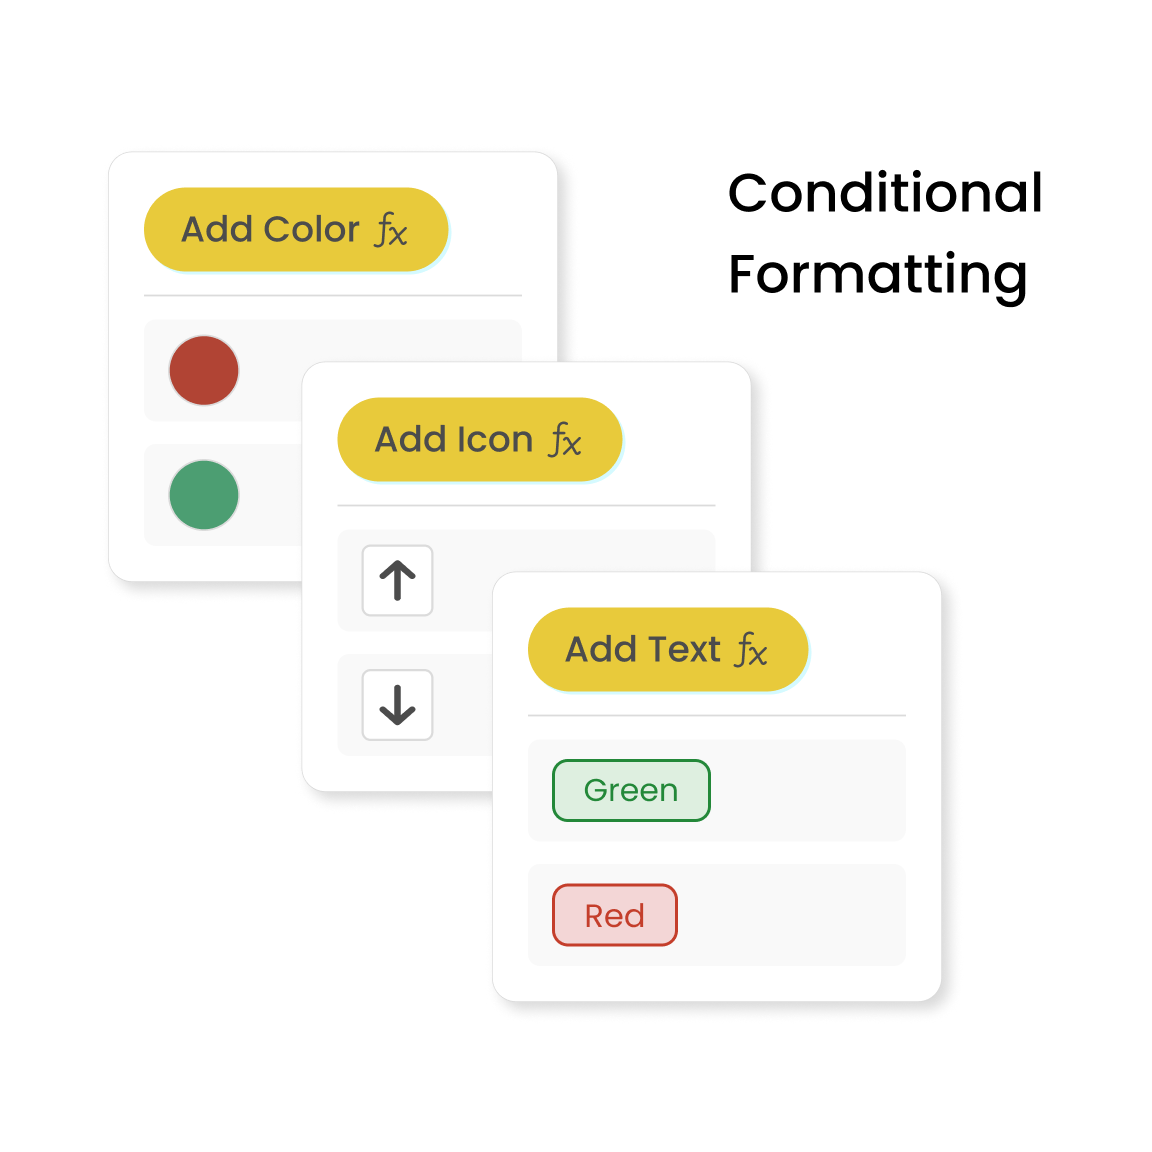
Highlight critical insights effortlessly. Dynamically control icons, bars, colors, and backgrounds across visuals based on preset rules, without the need for complex DAX formulas.
