Funnel chart is used for businesses to track data movement through different stages. It is great for understanding sales pipeline, marketing, and website traffic. The Powerviz funnel chart offers a range of features like different display styles, orientations, smart labels, conditional formatting, split stages into sub-section, ranking, fill pattern, conversion rate, and a wide range of colors.
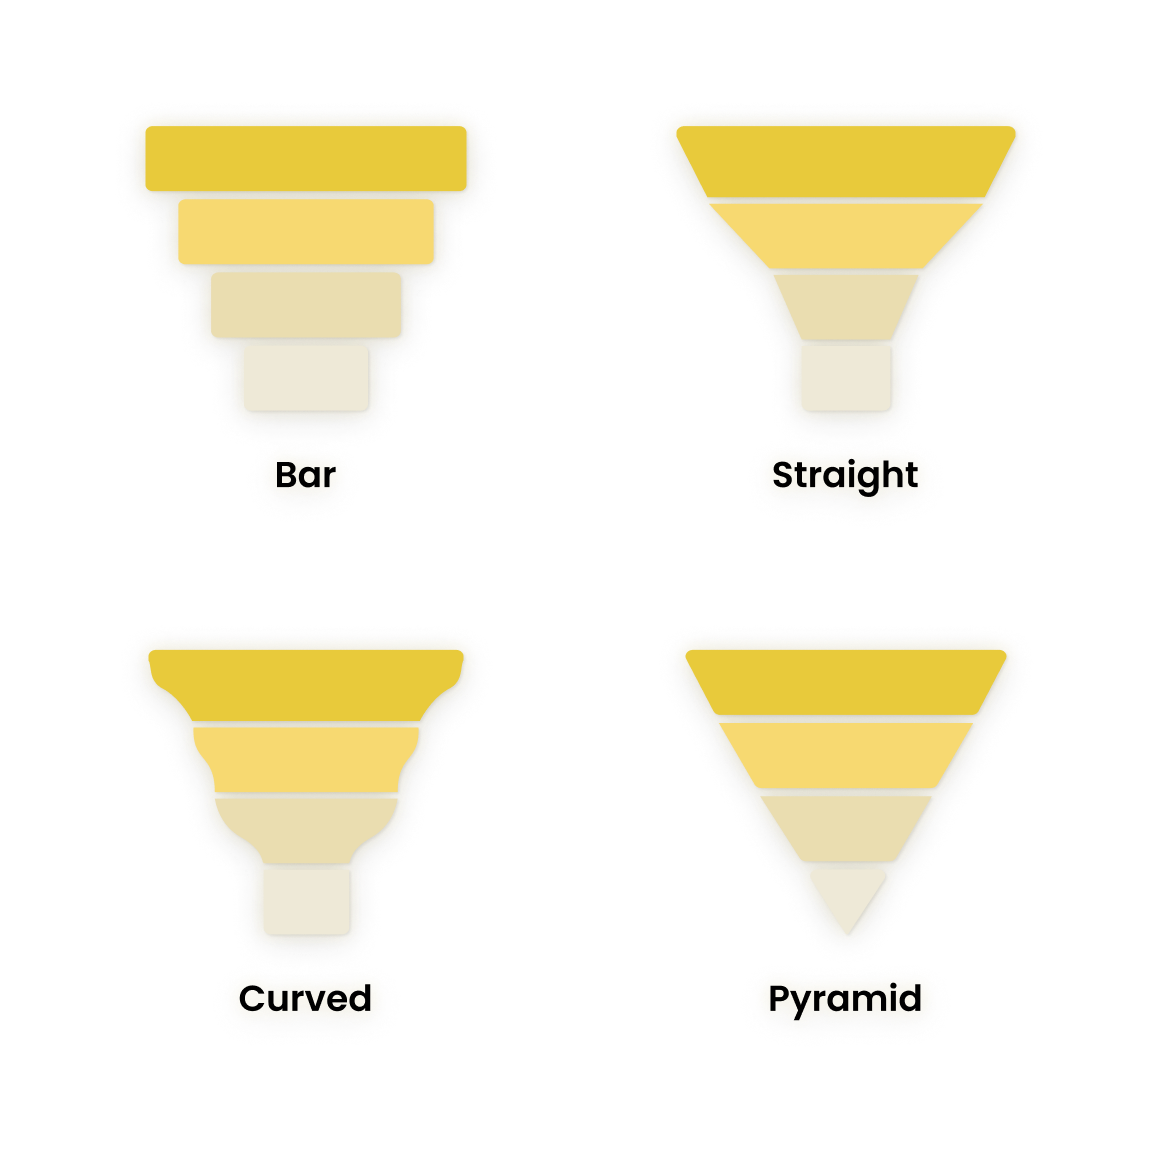
Instantly convert funnel into a pyramid chart or pick from one of the four unique styles.
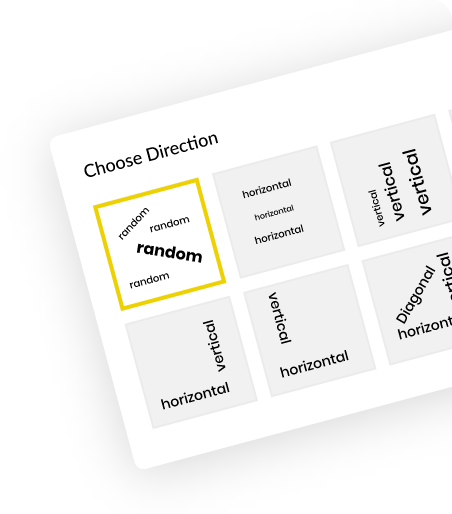
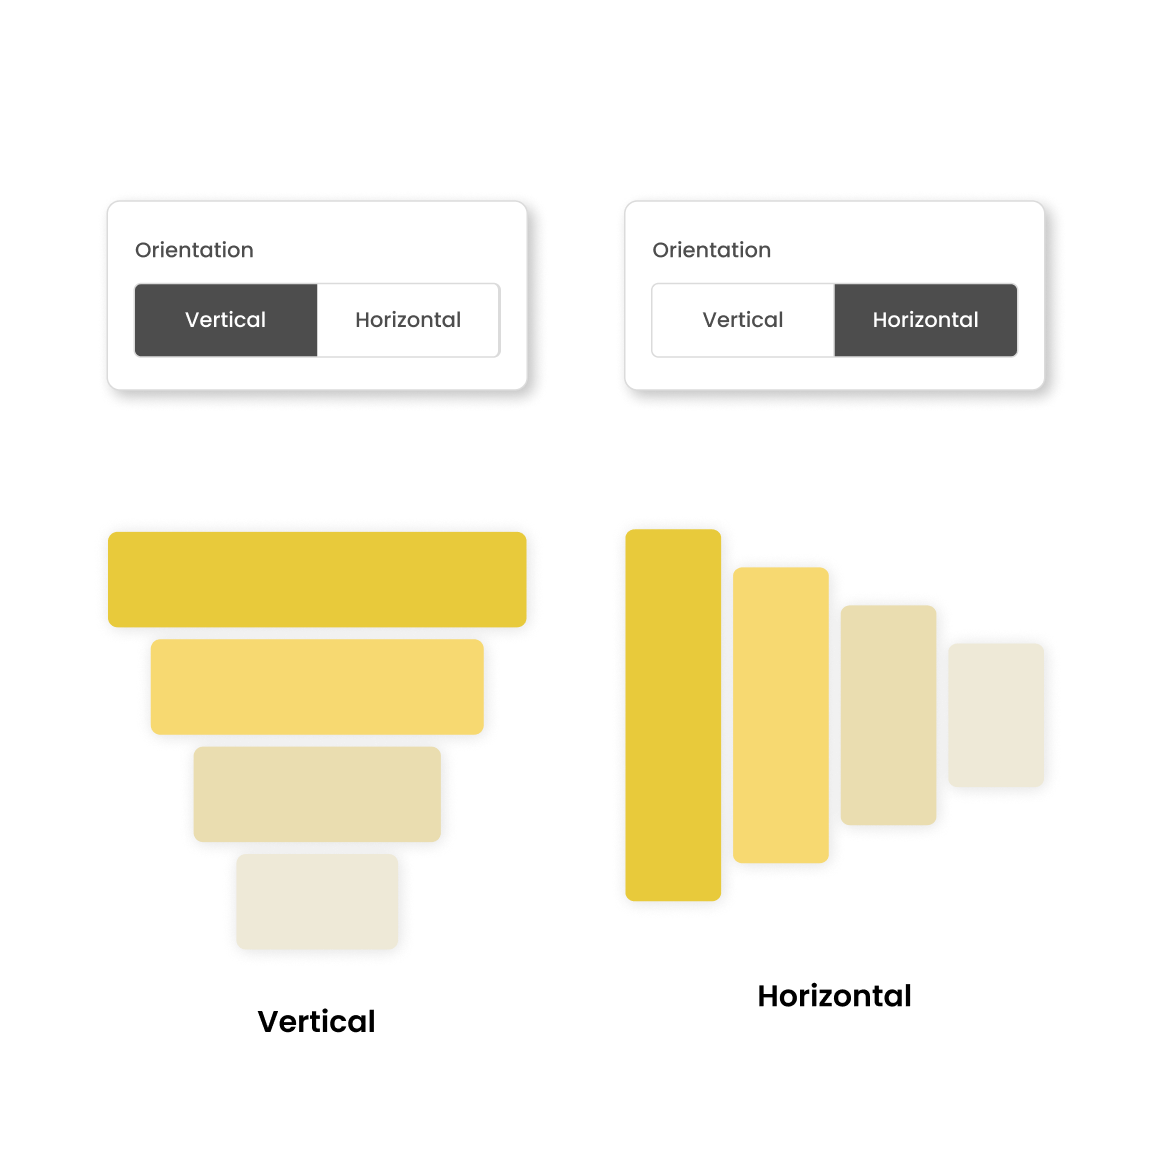
Switch between vertical or horizontal position. Give user flexibility in how to present and analyze the data.
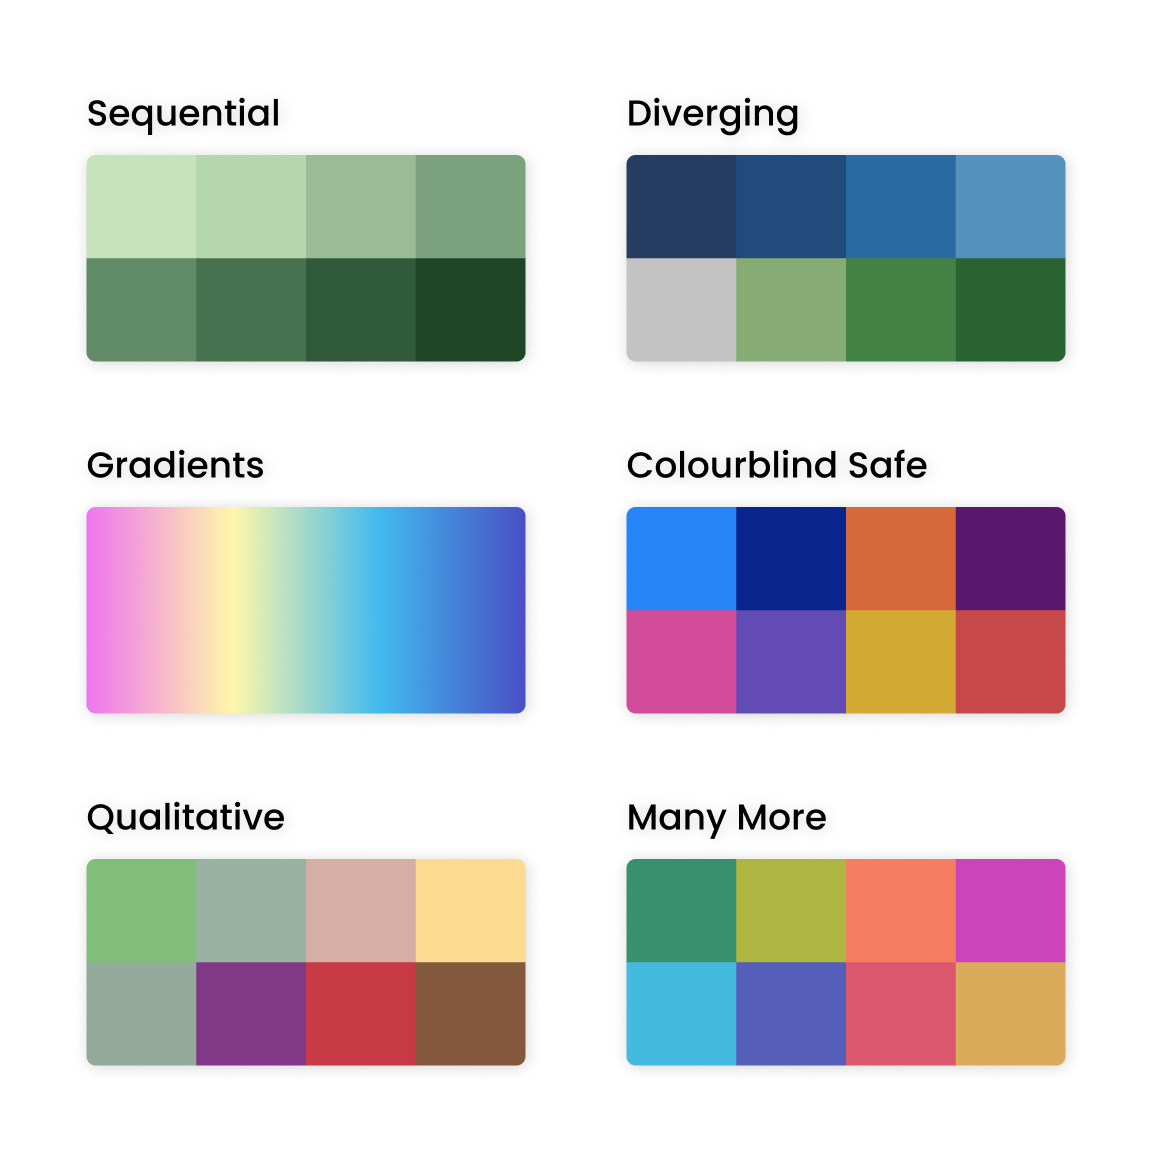
Choose from 7 color schemes and over 30 color palettes, including colorblind-safe options.
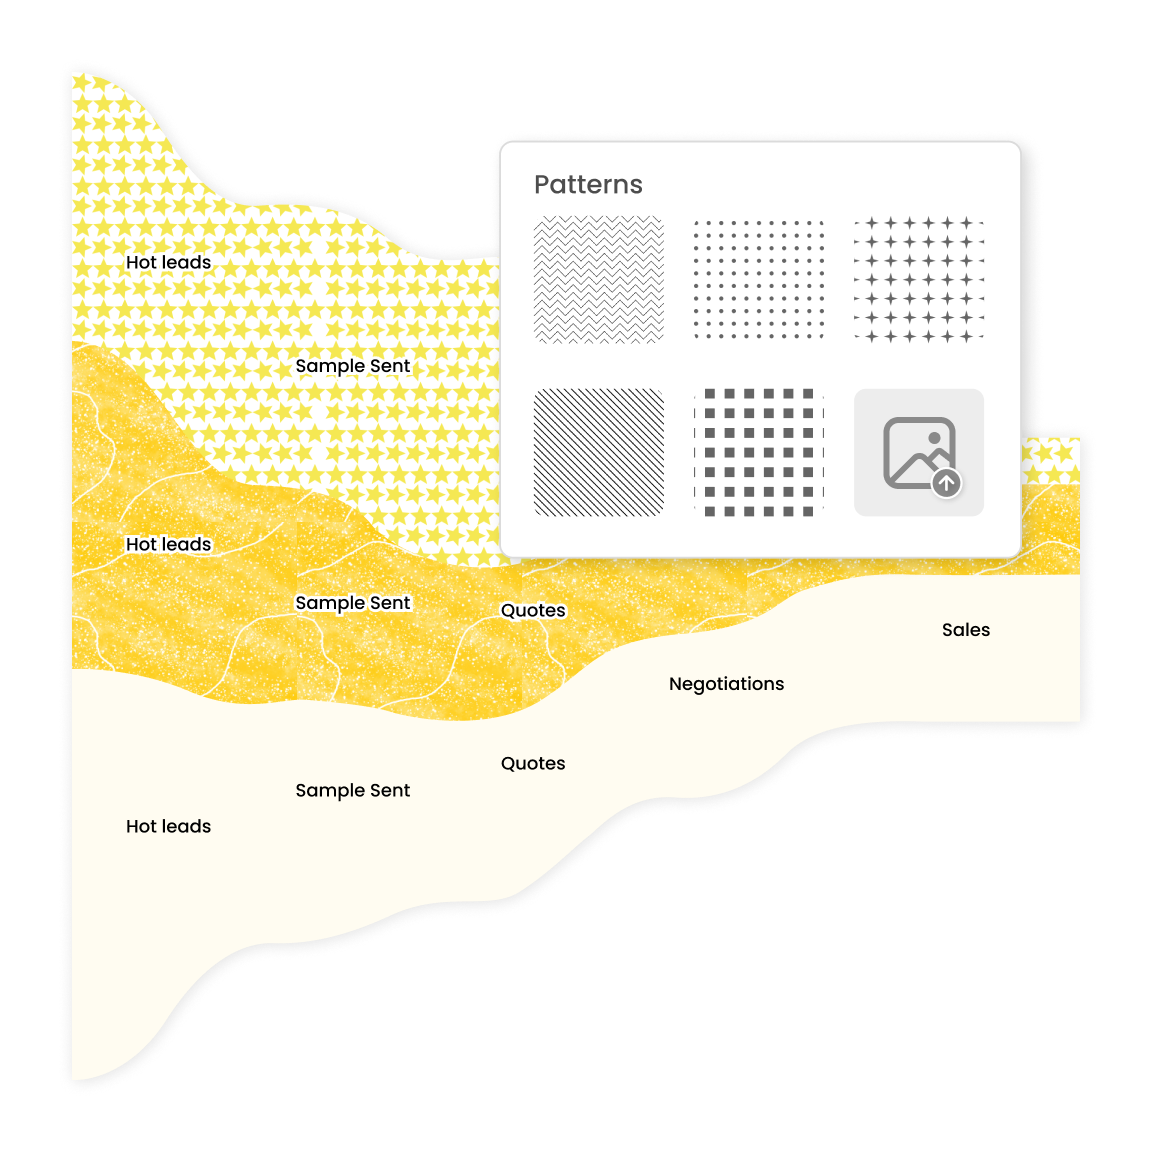
Apply patterns by picking from a wide range of options or add your own.
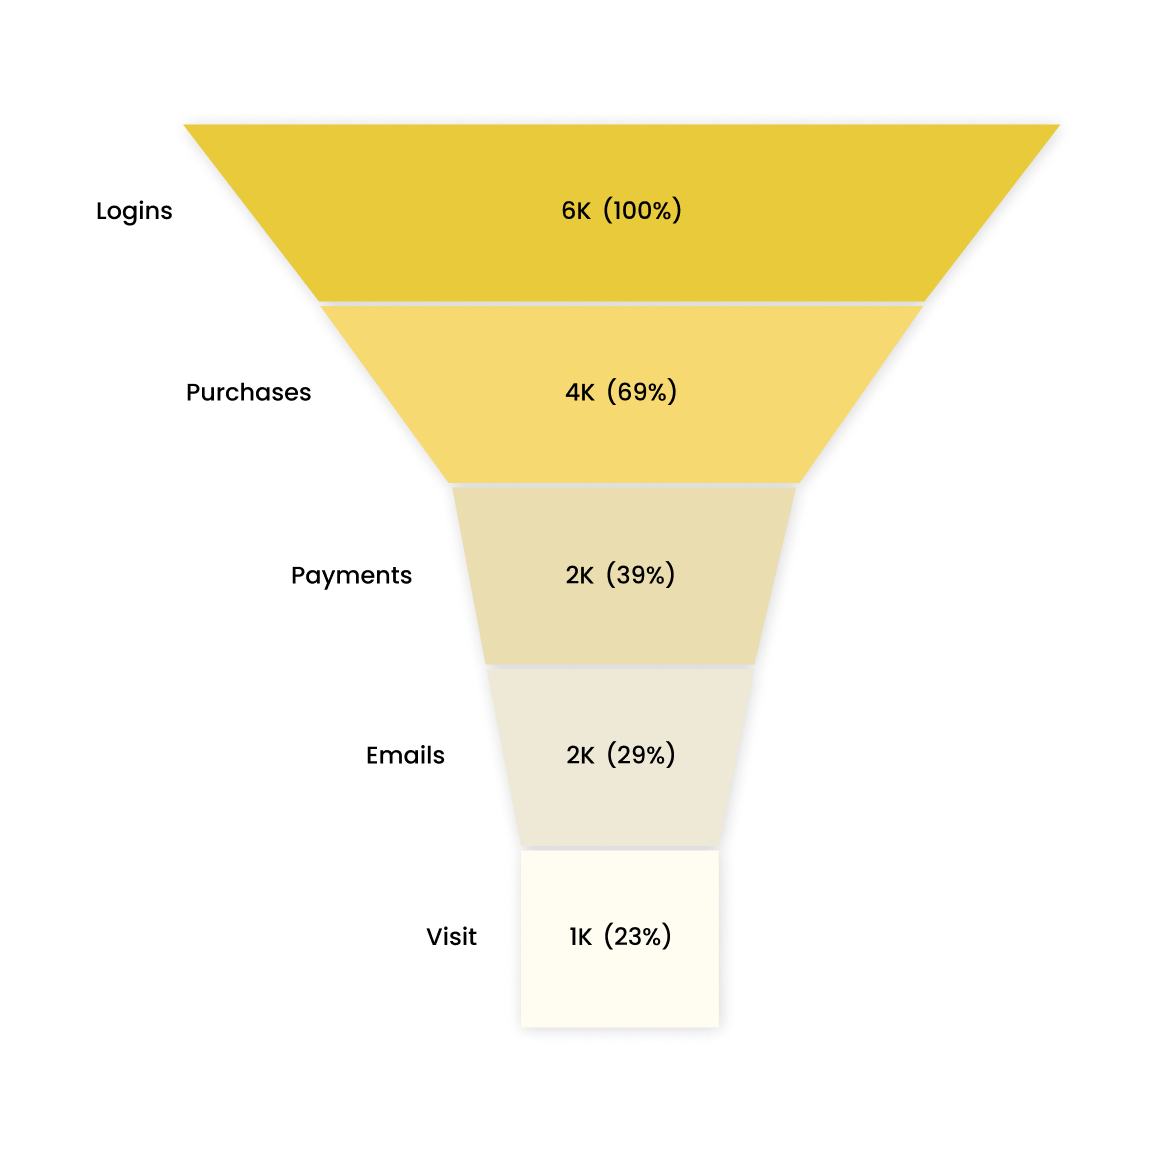
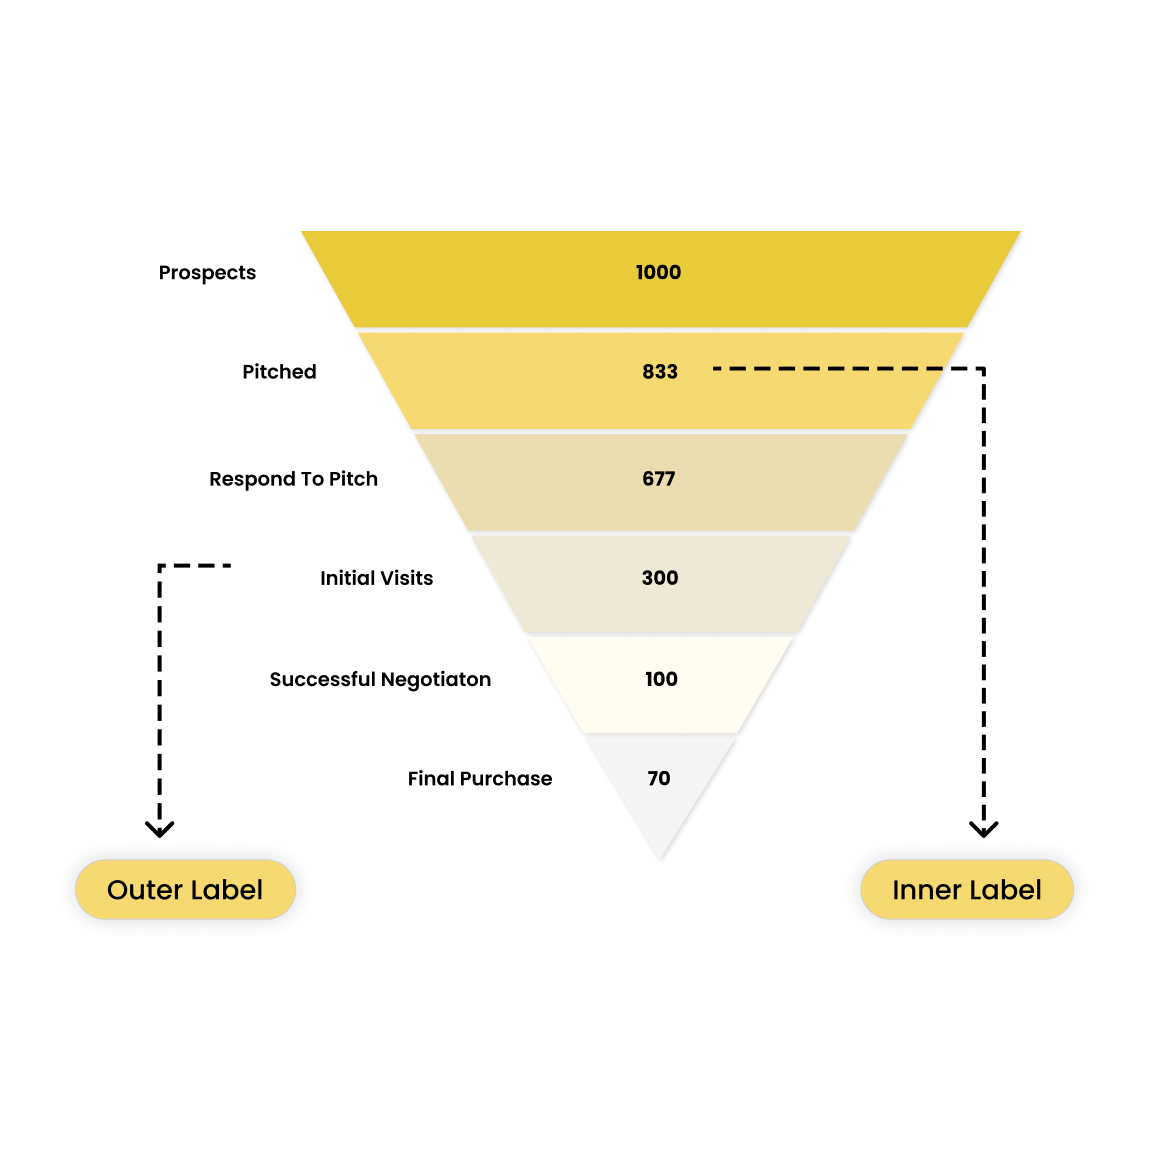
Place labels inside or outside the funnel chart. Get full control over the display type choose from 10+ options or add custom labels.
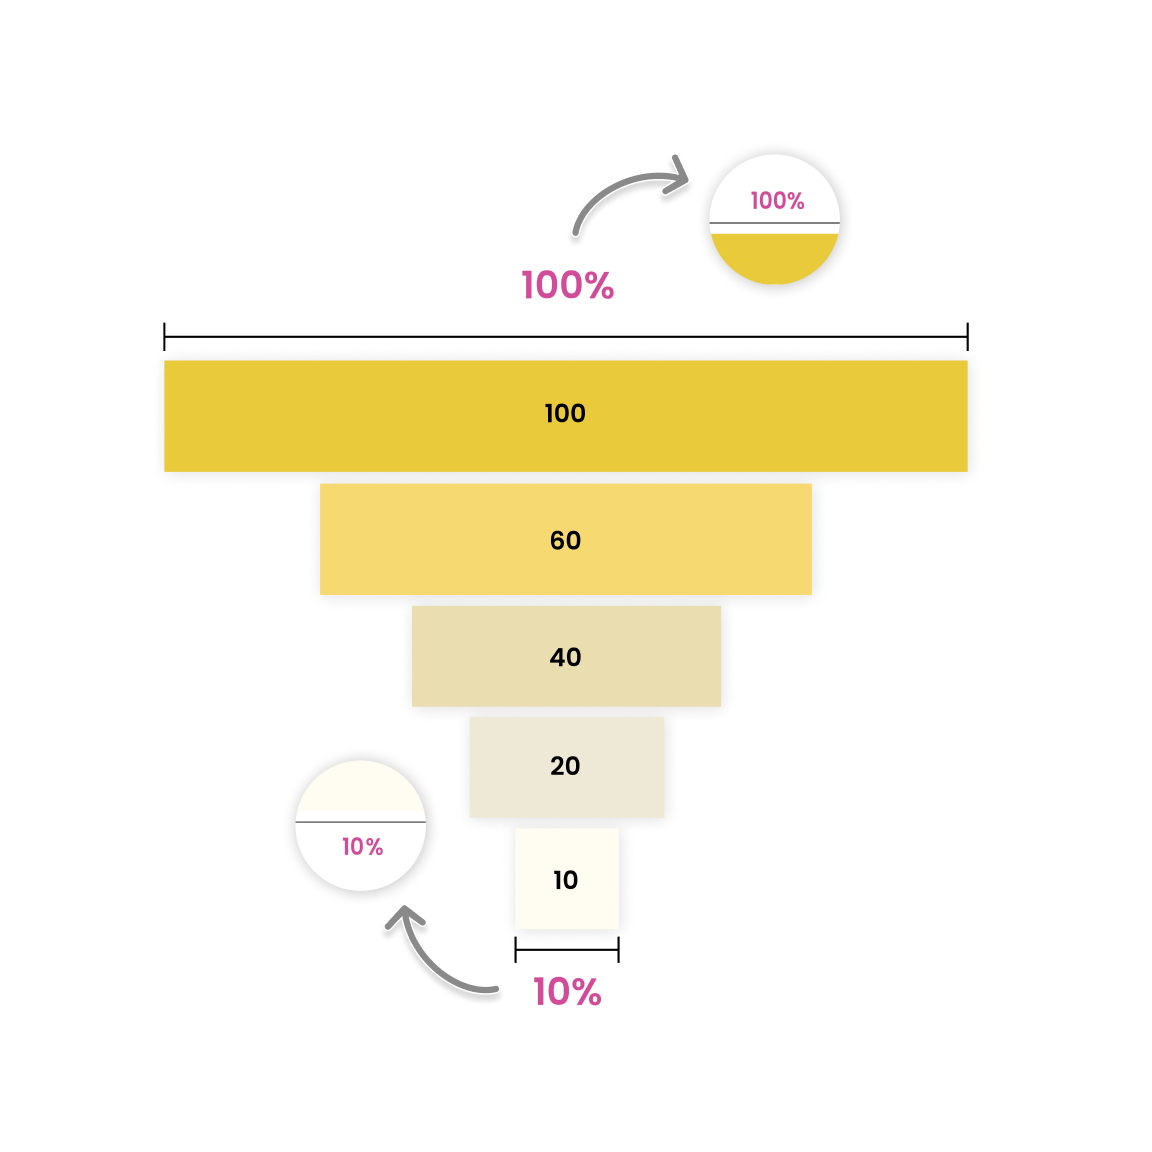
Enhance process efficiency by adding conversion rates to your funnel chart.
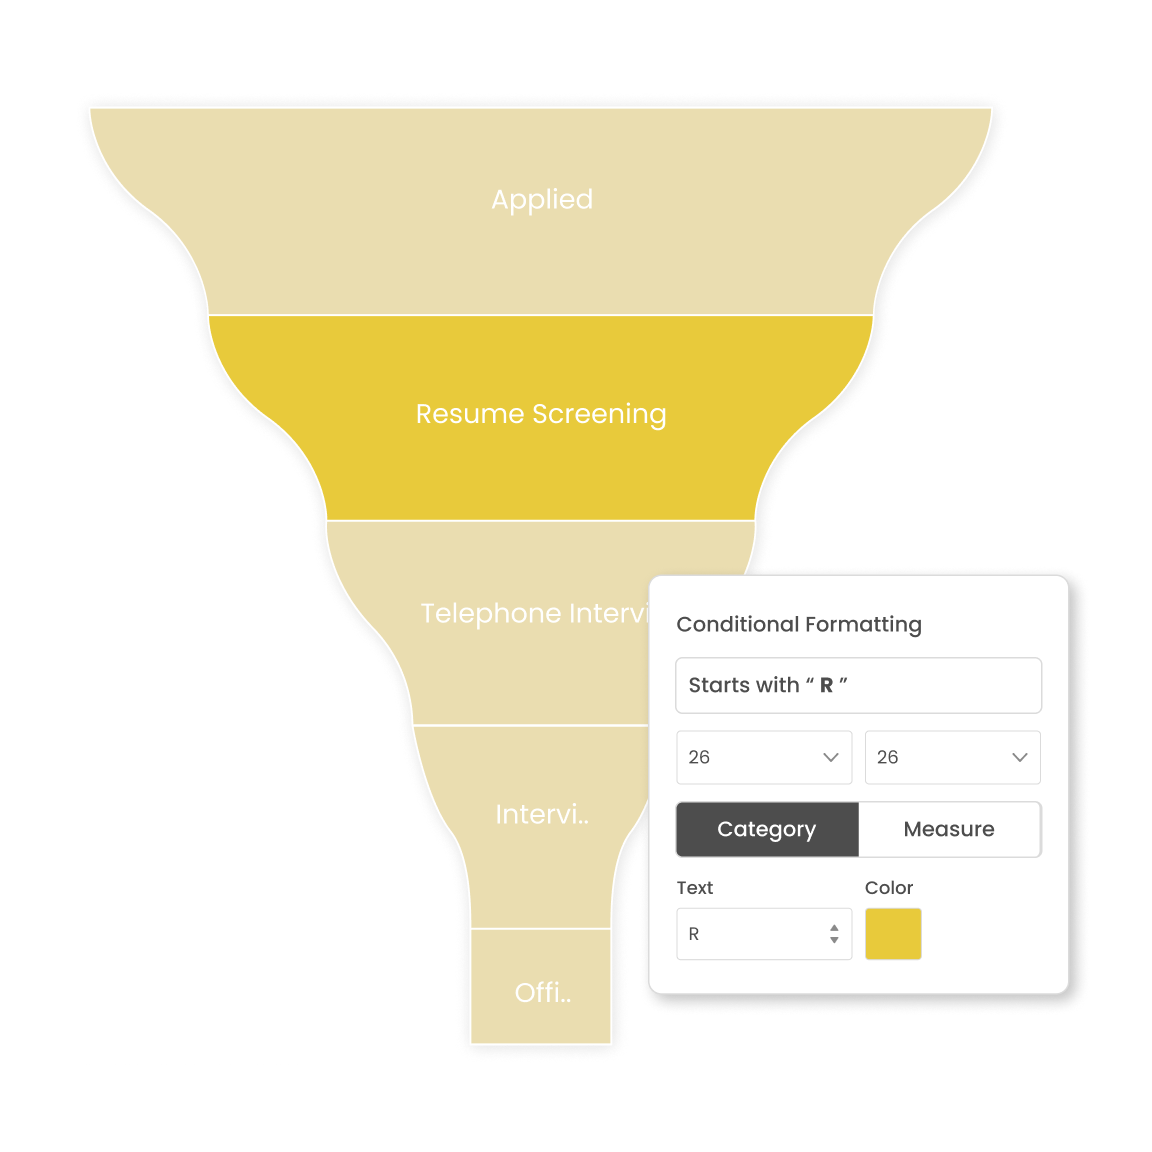
Easily spot outlier or highlight a stage. Apply conditional color based on category or measure field.